United States

Executive Summary Low-Yielding Countries Facing High USD Hedging Costs
Low-Yielding Countries Facing High USD Hedging Costs
Low-Yielding Countries Facing High USD Hedging Costs
The US dollar will remain strong alongside continued Fed rate hikes. Interest rate differentials will remain positive for the greenback, alongside other USD-positive factors like slowing global growth and rising investor risk aversion. Relatively high US interest rates have made hedging away US currency risk very expensive for some of the largest holders of US Treasuries like Japan. US Treasury yields, on an FX-hedged basis, look unattractive relative to local currency denominated bonds across the developed world. Increased foreign demand for US Treasuries evident in the US TIC data appears to reflect a re-establishment of positions unwound by global hedge funds and mutual funds dating back to the 2020 “dash for cash” in global financial markets. UST yields must rise even further versus non-US yields to attract more fundamental buyers like Japanese and European institutional investors, given elevated volatility in both US Treasury prices and the dollar. Bottom Line: Global investors should continue to underweight US Treasuries in global bond portfolios, on both a currency-unhedged and USD-hedged basis. Feature Dear Client, The schedule for the next two Global Fixed Income Strategy reports will be impacted by the upcoming Labor Day holiday and next week’s BCA’s annual conference in New York (I hope to see you there!). This Friday, September 2, we will be publishing a joint report with our colleagues at Foreign Exchange Strategy discussing Japan. On Monday, September 12, we will be publishing another joint report with our colleagues at European Investment Strategy, covering estimates of global neutral interest rates. -Rob Robis The title of our report from four weeks ago was “Dovish Central Bank Pivots Will Come Later Than You Think.” This could have also been the title for Fed Chair Jerome Powell's Jackson Hole speech. He reiterated the Fed’s commitment to tighten policy further and “keep at it” until the US economy slows enough to bring down inflation. Other central bankers who spoke at the conference had a similar tone to Powell, talking up an ongoing inflation fight that will require much slower growth and higher unemployment. Related Report Global Fixed Income StrategyRecent USD Strength Is Not Bond Bullish By quickly and bluntly dispensing any notion that the Fed could soon pause its rate hiking cycle, Powell poured ice cold water on the risk asset rally that boosted the S&P 500 by nearly 17% between mid-June and mid-August. The S&P 500 plunged 3.4% after Powell’s speech, a tightening of US financial conditions that was likely welcomed by the Fed, as it helps their goal of slowing the US economy. Minneapolis Fed President Neil Kashkari even said he was “happy” to see the negative market reaction to Powell’s speech. Powell, Kashkari and the rest of the FOMC are probably happy over the strength of the US dollar, which is also helping tighten US financial conditions – while also having a major impact on global bond returns and currency hedging decisions for investors. A Collision Of A USD Bull Market & Global Bond Bear Market Chart 1A Big Move In The USD
A Big Move In The USD
A Big Move In The USD
The current strength of the US dollar is becoming increasingly broad-based. The EUR/USD exchange rate has fallen below parity, while USD/JPY continues to flirt with the 140 level (Chart 1). The British pound is trading at a 2-year low versus the US dollar, many important emerging market (EM) currencies are struggling, and the Chinese renminbi is set to retest the 7.0 level. The strength of the US dollar is no recent phenomenon. The current uptrend dates back to the start of 2021, with the DXY dollar index up 21% since then. The dollar bull market has been supported by several factors, most critically rising US interest rates. The 2-year US Treasury yield started 2021 just above 0% and now sits at 3.4%. Higher US interest rates have raised the benefit of hedging currency risk into US dollars for global bond investors. The Bloomberg Global Aggregate Bond Index in USD-hedged terms has outperformed the unhedged version of the index by 6.3% over the past year, one of the largest such increases dating back to 2000 (Chart 2). This means that global bond investors have been paid handsomely to simply swap non-US bond exposures into US dollars – in some cases, making low-yielding assets like Japanese government bonds (JGBs), hedged from yen into dollars, comparable to US Treasury yields. Chart 2Big Gains From Hedging Global Bond Exposure Into USD
Big Gains From Hedging Global Bond Exposure Into USD
Big Gains From Hedging Global Bond Exposure Into USD
This wedge between USD-hedged and unhedged bond returns is unlikely to reverse soon, as the fundamental drivers of the dollar remain biased to more dollar strength. The US dollar is not only supported by more favorable interest rate differentials versus other currencies (both in nominal and inflation-adjusted terms), but is also benefitting from its safe haven status at a time of considerable uncertainty on the future of the global economy (Chart 3). Global growth expectations are depressed and showing no signs of turning around anytime soon, particularly in Europe and the UK where electricity and gas prices are climbing at a record pace. The dollar not only typically appreciates during periods of slowing growth, but also during episodes of investor risk aversion. Investors remain cautious, according to indicators like the US equity put/call ratio which shows greater demand for downside protection via puts – an outcome that also typically coincides with a stronger US dollar. In this current environment of broad-based US dollar strength, the gap between hedged and unhedged bond returns has varied widely depending on the base currency of the investor. For a euro-based investor, the performance gap between the unhedged Global Aggregate index and the EUR-hedged index has been 6% over the past year (Chart 4). Chart 3USD Strength Supported By Key Fundamental Drivers
USD Strength Supported By Key Fundamental Drivers
USD Strength Supported By Key Fundamental Drivers
Chart 4FX Hedging Decisions Mean Everything In A Global Bond Bear Market
FX Hedging Decisions Mean Everything In A Global Bond Bear Market
FX Hedging Decisions Mean Everything In A Global Bond Bear Market
Chart 5Low-Yielding Countries Facing High USD Hedging Costs
Low-Yielding Countries Facing High USD Hedging Costs
Low-Yielding Countries Facing High USD Hedging Costs
The gap has been even larger for yen-based investors, with the unhedged index beating the JPY-hedged index by a whopping 13% over the past twelve months. Although Japanese fixed income investors are not typically known for taking unhedged currency risk on foreign bond holdings, doing so would have turned an awful year of global bond returns into a great year, simply due to yen weakness. When looking at current levels of interest rate differentials versus the US, which are the main determinant of currency hedging costs, the low yielding currencies like the euro, yen and Swiss franc see the greatest gain on returns versus the high-yielding US dollar (Chart 5). Hedging euros into dollars results in an annualized pickup of 252bps, while hedging yen into dollars produces an even bigger gain of 327bps. At the same time, the USD-hedging gains for relatively higher yielders are much lower. Hedging Australian dollars into US dollars only produces an annualized gain of 48bps, while hedging Canadian dollars into US dollars produces an annualized loss of -18bps. These varying hedging costs matter for global bond investors, as they impact the attractiveness of an individual country’s bond yields, depending on the investor’s base currency. We show the unhedged yield levels, and currency-hedged yield levels for six main developed market base currencies (USD, EUR, JPY, GBP, CAD, AUD) in the tables on the next two pages. Table 1 shows 2-year government bond yields, Table 2 shows 5-year government bond yields, Table 3 shows 10-year government bond yields and Table 4 shows 30-year government bond yields. Unsurprisingly, hedging into euros and yen, where short-term interest rates are the lowest, produces the smallest yields. Meanwhile, hedging into higher-rate currencies like US dollars and Canadian dollars generates the highest yields. Table 1Currency-Hedged 2-Year Government Bond Yields
Currency Hedging Matters More Than Ever For Bond Investors
Currency Hedging Matters More Than Ever For Bond Investors
Table 2Currency-Hedged 5-Year Government Bond Yields
Currency Hedging Matters More Than Ever For Bond Investors
Currency Hedging Matters More Than Ever For Bond Investors
Table 3Currency-Hedged 10-Year Government Bond Yields
Currency Hedging Matters More Than Ever For Bond Investors
Currency Hedging Matters More Than Ever For Bond Investors
Table 4Currency-Hedged 30-Year Government Bond Yields
Currency Hedging Matters More Than Ever For Bond Investors
Currency Hedging Matters More Than Ever For Bond Investors
We take the analysis a step further in the next set of tables on pages 9-11. Here, we take the hedged yields for each currency and compare them to the yields of the base currency. For example, in Table 5, it can be seen that a 2-year US Treasury yield of 3.4%, hedged into euros, produces a yield of 0.82% that is -17bps below the 2-year German yield (which is obviously denominated in euros). In other words, from the point of view of a euro-based investor who wants to hedge away the currency risk in a global bond portfolio, he gets paid a bit more to own a German bond over a US Treasury. Table 5Currency-Hedged 2-Year Govt. Bond Yield Spreads
Currency Hedging Matters More Than Ever For Bond Investors
Currency Hedging Matters More Than Ever For Bond Investors
Similar results are shown in the subsequent tables for 5-year yields (Table 6), 10-year yields (Table 7) and 30-year yields (Table 8). From these tables, we can make the following broad conclusions: Table 6Currency-Hedged 5-Year Govt. Bond Yield Spreads
Currency Hedging Matters More Than Ever For Bond Investors
Currency Hedging Matters More Than Ever For Bond Investors
Table 7Currency-Hedged 10-Year Govt. Bond Yield Spreads
Currency Hedging Matters More Than Ever For Bond Investors
Currency Hedging Matters More Than Ever For Bond Investors
Table 8Currency-Hedged 30-Year Govt. Bond Yield Spreads
Currency Hedging Matters More Than Ever For Bond Investors
Currency Hedging Matters More Than Ever For Bond Investors
For USD-based bond investors, all non-US markets except Canada have a yield pickup over US Treasuries on an FX-hedged basis For EUR-based investors, all non-euro area markets except Australia produce yields lower than those of Germany on an FX-hedged basis For GBP-based investors, all non-UK bond markets except the US and Canada have yields greater than those of Gilts for maturities from 5-30 years (the results are more mixed across countries for 2-year yields) For JPY-based investors, euro area and Australian bonds are clearly more attractive than JGBs on an FX-hedged basis, while US Treasuries, UK Gilts and Canadian government bonds offer FX-hedged yields below puny JGB yields. This is true up to the 10-year maturity point, as 30-year JGB yields – which are not targeted by the Bank of Japan in its yield curve control program – are much higher than those on the rest of the JGB curve For CAD-based investors, hedging virtually all non-Canadian bonds into CAD results in yields that are higher than Canadian government bond yields, with the largest hedged yield advantage for euro area and Australian bonds For AUD-based investors, only euro area bonds offer a consistent yield pickup over Australian government bonds on an FX-hedged basis. Broadly speaking, government bonds in the euro area and Australia offer consistently attractive FX-hedged yield pickups over the unhedged bonds for all currencies shown in the tables. On the other hand, Canadian government bonds have consistently less attractive FX-hedged yields across all currencies shown. Perhaps most importantly, US Treasuries look unattractive on an FX-hedged basis to all but CAD-based investors – a result that has meaningful implications for the potential of foreign buying to help stem the rise of US bond yields. Bottom Line: The US dollar bull market is having a huge influence on global bond returns. US Treasury yields, on an FX-hedged basis, look unattractive relative to most local currency denominated bonds across the developed world. Who Are The Foreign Buyers Of US Treasuries? When simply looking at currency-unhedged yield spreads, US Treasury yields offer particularly inviting yields over low-yielding (and low “beta” to US yields) markets like Germany and Japan. The unhedged 10-year US-Germany spread is now 160bps, while the unhedged US-Japan spread is up to 286bps (Chart 6). Meanwhile, among high-beta markets, the US-Canada 10-year spread is flat on an FX-unhedged basis, while an unhedged Australian 10-year bond yields 56bps more than a 10-year US Treasury. Chart 6UST Yields Only Look Attractive In FX-Unhedged Terms
UST Yields Only Look Attractive In FX-Unhedged Terms
UST Yields Only Look Attractive In FX-Unhedged Terms
Yet after factoring in the currency hedging costs shown earlier, US Treasuries look consistently unattractive versus the other major developed economy bond markets. Chart 7UST Yields Look Unattractive After Hedging Out USD Exposure
UST Yields Look Unattractive After Hedging Out USD Exposure
UST Yields Look Unattractive After Hedging Out USD Exposure
A 10-year US Treasury hedged into euros now yields -77bps less than a 10-year German bund, at the low end of the historical range for this spread dating back to 2000 (Chart 7). A 10-year Treasury hedged into GBP and JPY also offers lower yields versus 10-year UK Gilts (-11bps) and 10-year JGBs (-50bps), respectively. The 10-year hedged US-Australia spread (with the US yield hedged into AUD) is also at a stretched negative extreme at -114bps (Chart 8). Despite these broadly unattractive hedged US yield spreads, the US Treasury market has seen significant foreign inflows this year, according to the US Treasury Department’s capital flow (TIC) data. Total net purchases of US Treasuries by foreign buyers accelerated to $470bn (on a 12-month rolling total basis) as of the latest data for June (Chart 9). When broken down by type of buyer, private buyers bought a net $619bn, while official buyers were net sellers to the tune of -$149bn. Chart 8No Compelling Yield Advantage To Owning FX-Hedged USTs
No Compelling Yield Advantage To Owning FX-Hedged USTs
No Compelling Yield Advantage To Owning FX-Hedged USTs
When looking at the TIC data by country, China was an important net seller of -$18bn of Treasuries. This is consistent with the reduced demand for US dollar assets from China, where policymakers are actively targeting a weaker renminbi. Chart 9TIC Data Shows USTs Seeing Foreign Buying (Ex-China)
TIC Data Shows USTs Seeing Foreign Buying (Ex-China)
TIC Data Shows USTs Seeing Foreign Buying (Ex-China)
There was also net selling from many EM countries that have seen reduced trade surpluses and, hence, fewer US dollars to recycle into Treasuries. Chart 10Even Higher UST Yields Needed To Entice Japanese & European Buyers
Even Higher UST Yields Needed To Entice Japanese & European Buyers
Even Higher UST Yields Needed To Entice Japanese & European Buyers
The largest net buying (Chart 10) was seen from the UK (+$306bn) and Cayman Islands (+$154bn) – the latter being a large source of Treasury buying through hedge funds and offshore investment funds located there. Those two countries accounted for almost all of the net foreign inflows into Treasuries, despite the fact they only hold a combined 12% of all foreign US Treasury holdings. There was modest net buying from the euro area (+$37bn) and small net selling by the country with the largest stock of US Treasury holdings, Japan. The relatively subdued inflows from Europe, and lack of inflows from Japan, are consistent with the unattractive hedged US-Europe and US-Japan yield spreads shown earlier, particularly at a time of elevated US bond yield volatility. The huge inflows from the UK and Cayman Islands are harder to explain on a fundamental basis, but are likely due to a continued normalization of Treasury market liquidity after the spring 2020 “dash for cash”. In a report published back in January, Fed researchers analyzed foreign demand for US Treasuries around the worst of the COVID pandemic shock in 2020. The report concluded that the huge collapse in private inflows into Treasuries – from a peak of +$238bn at the start of 2020 to a trough of -$373bn at the end of 2020 – was the result of aggressive net selling by hedge funds and global mutual funds. These are exactly the types of investors that would be domiciled in the Cayman Islands and UK (London). Specifically, the Fed report noted that: “In short, two prominent reasons for the large sales are the unwind of the Treasury basis trade by hedge funds (including foreign-domiciled funds) and the sudden, massive investor outflows from mutual funds that caused these funds to sell their most liquid assets, U.S. Treasury securities, to meet these redemptions.” The “basis trade” mentioned likely involved buying cash Treasuries versus selling Treasury futures, attempting to exploit unsustainable price differences between the two. As market liquidity conditions dried up in the spring of 2020 during the first wave of global lockdowns, leveraged bond investors needed to frantically unwind positions. For Treasury basis trades, that would have involved selling cash Treasuries, which was likely what is being picked up in the TIC data from the Cayman Islands which showed a huge plunge in net buying in 2020. The mutual fund outflows were likely a global phenomenon, but given the large fund management presence in London, the huge net selling of Treasuries from the UK in 2020 were almost certainly related to global fund managers, not purely UK investors. As Treasury market liquidity conditions normalized in 2021 and 2022, those large sellers in the UK and Cayman Islands (and other offshore investment locations) have likely turned into big net buyers, as evidenced from the TIC data. However, the modest inflows from Europe, and outflows from Japan, tell a more important story about the fundamental demand for US Treasuries. Treasury yields must rise further, widening both currency-hedged and unhedged spreads versus non-US government bonds to more historically attractive levels, to entice more foreign buying. Bottom Line: UST yields must rise even further versus non-US yields to attract more fundamental buyers like Japanese and European institutional investors, given elevated volatility in both US Treasury prices and the dollar. Global investors should underweight US Treasuries in global bond portfolios, on both a currency-unhedged and USD-hedged basis. Robert Robis, CFA Chief Fixed Income Strategist rrobis@bcaresearch.com GFIS Model Bond Portfolio Recommended Positioning Active Duration Contribution: GFIS Recommended Portfolio Vs. Custom Performance Benchmark
Currency Hedging Matters More Than Ever For Bond Investors
Currency Hedging Matters More Than Ever For Bond Investors
The GFIS Recommended Portfolio Vs. The Custom Benchmark Index Global Fixed Income - Strategic Recommendations*
Currency Hedging Matters More Than Ever For Bond Investors
Currency Hedging Matters More Than Ever For Bond Investors
Tactical Overlay Trades
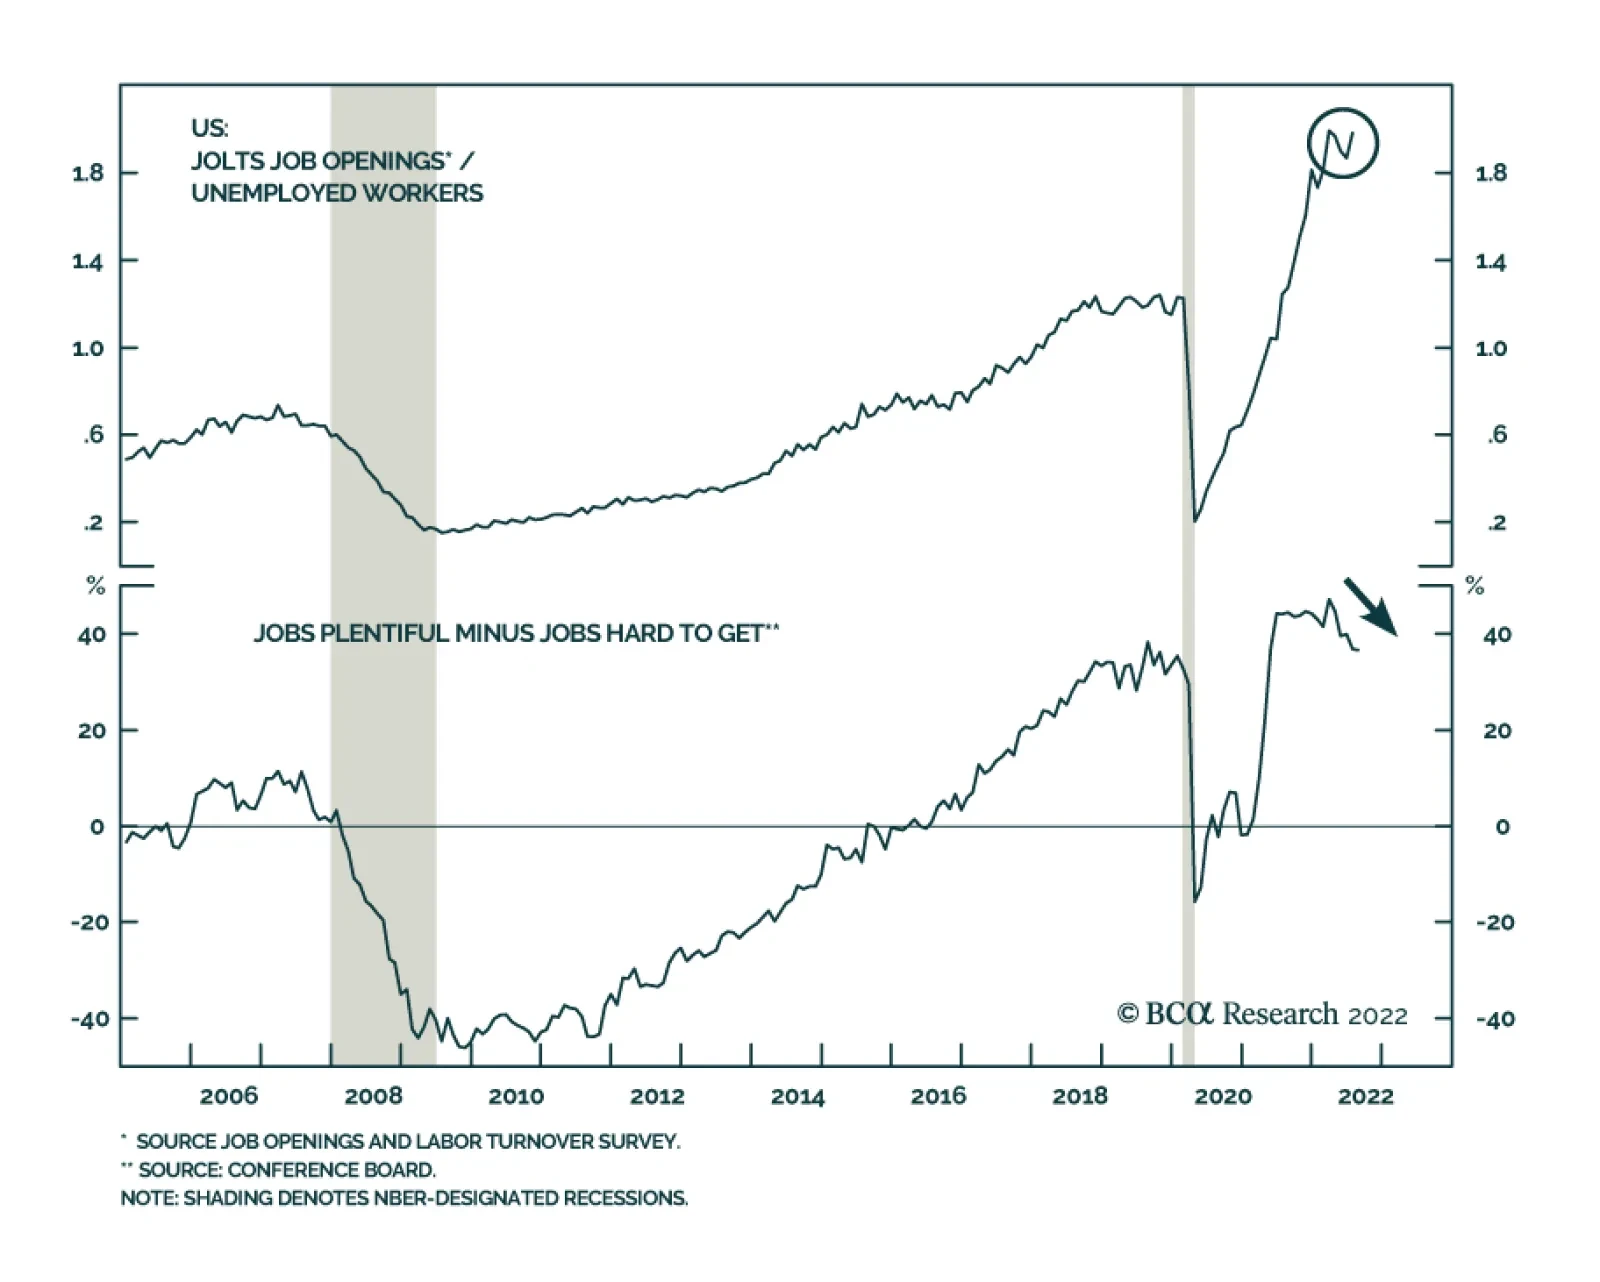
After having declined for three consecutive months, job openings unexpectedly rose to 11.2 million in July, from an upwardly revised 11 million in June, beating expectations they would continue to decrease. Transportation, warehousing and utilities, as well…
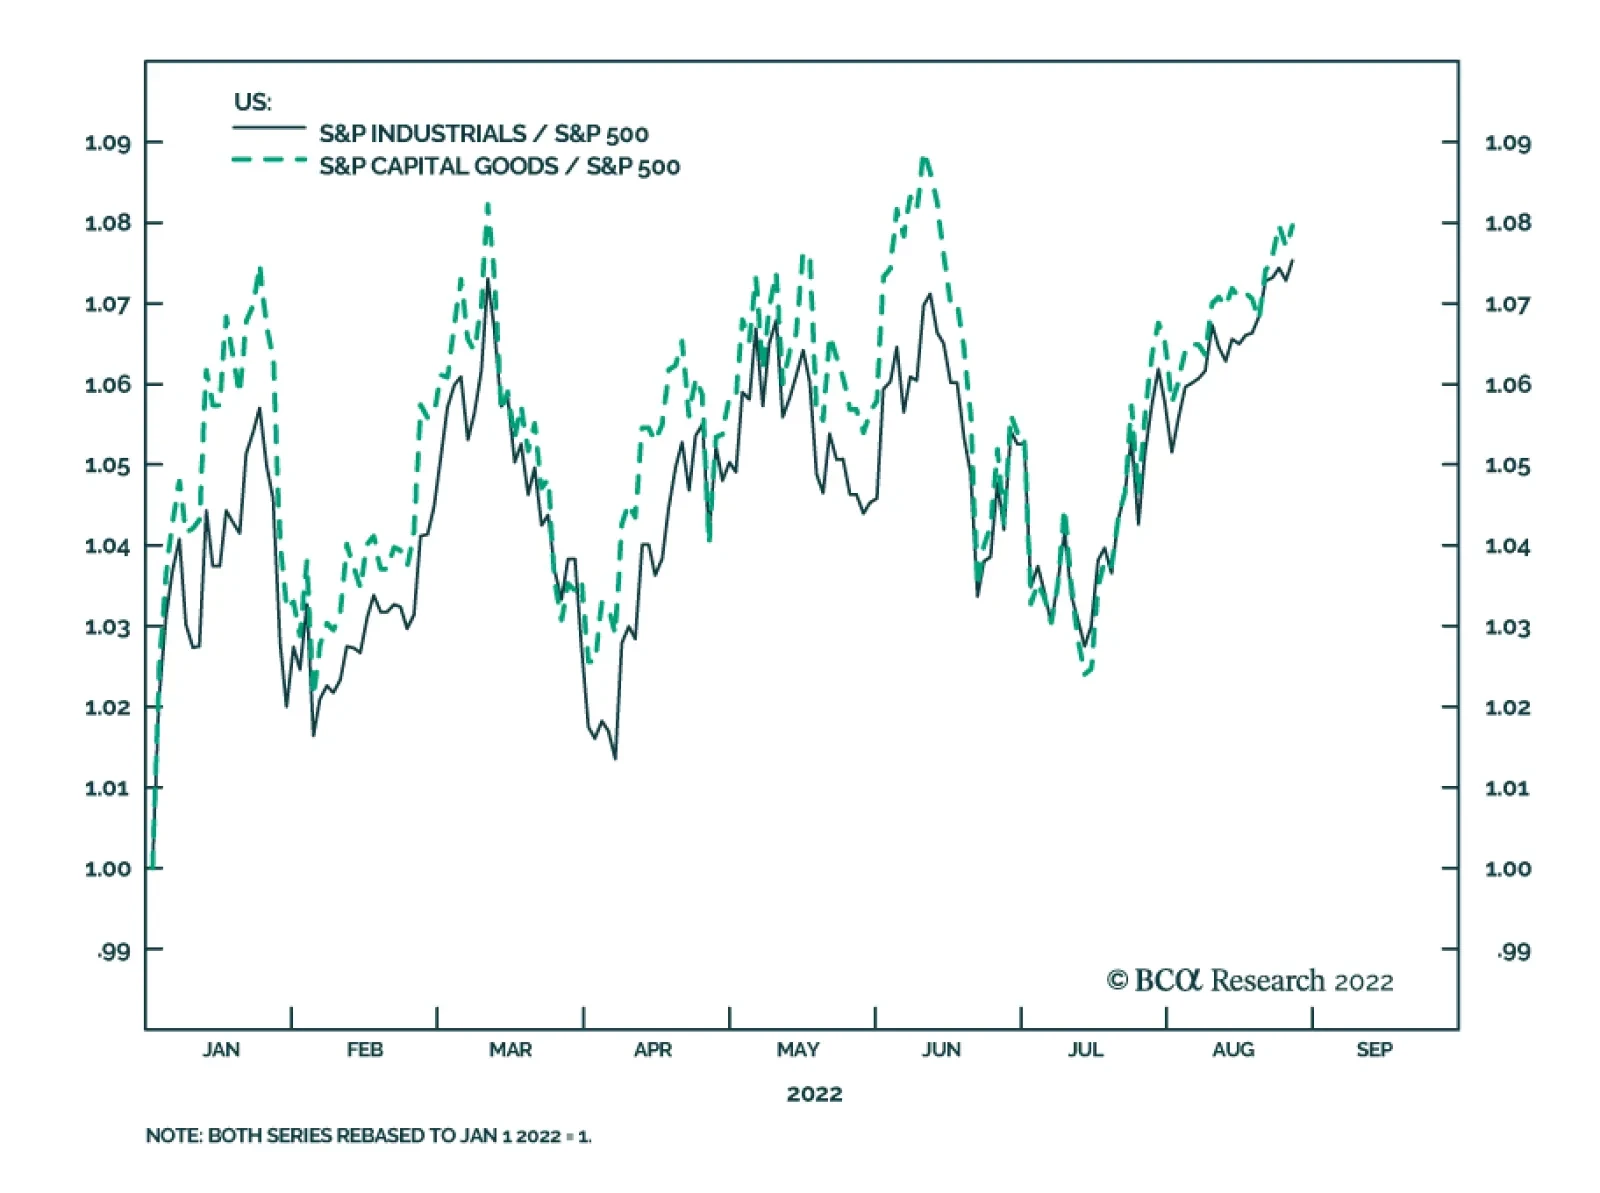
US industrial stocks face conflicting forces. On the one hand, the macroeconomic environment poses challenges to this sector. Industrial stocks typically underperform when economic growth conditions deteriorate. Our US Equity strategists recently showed…
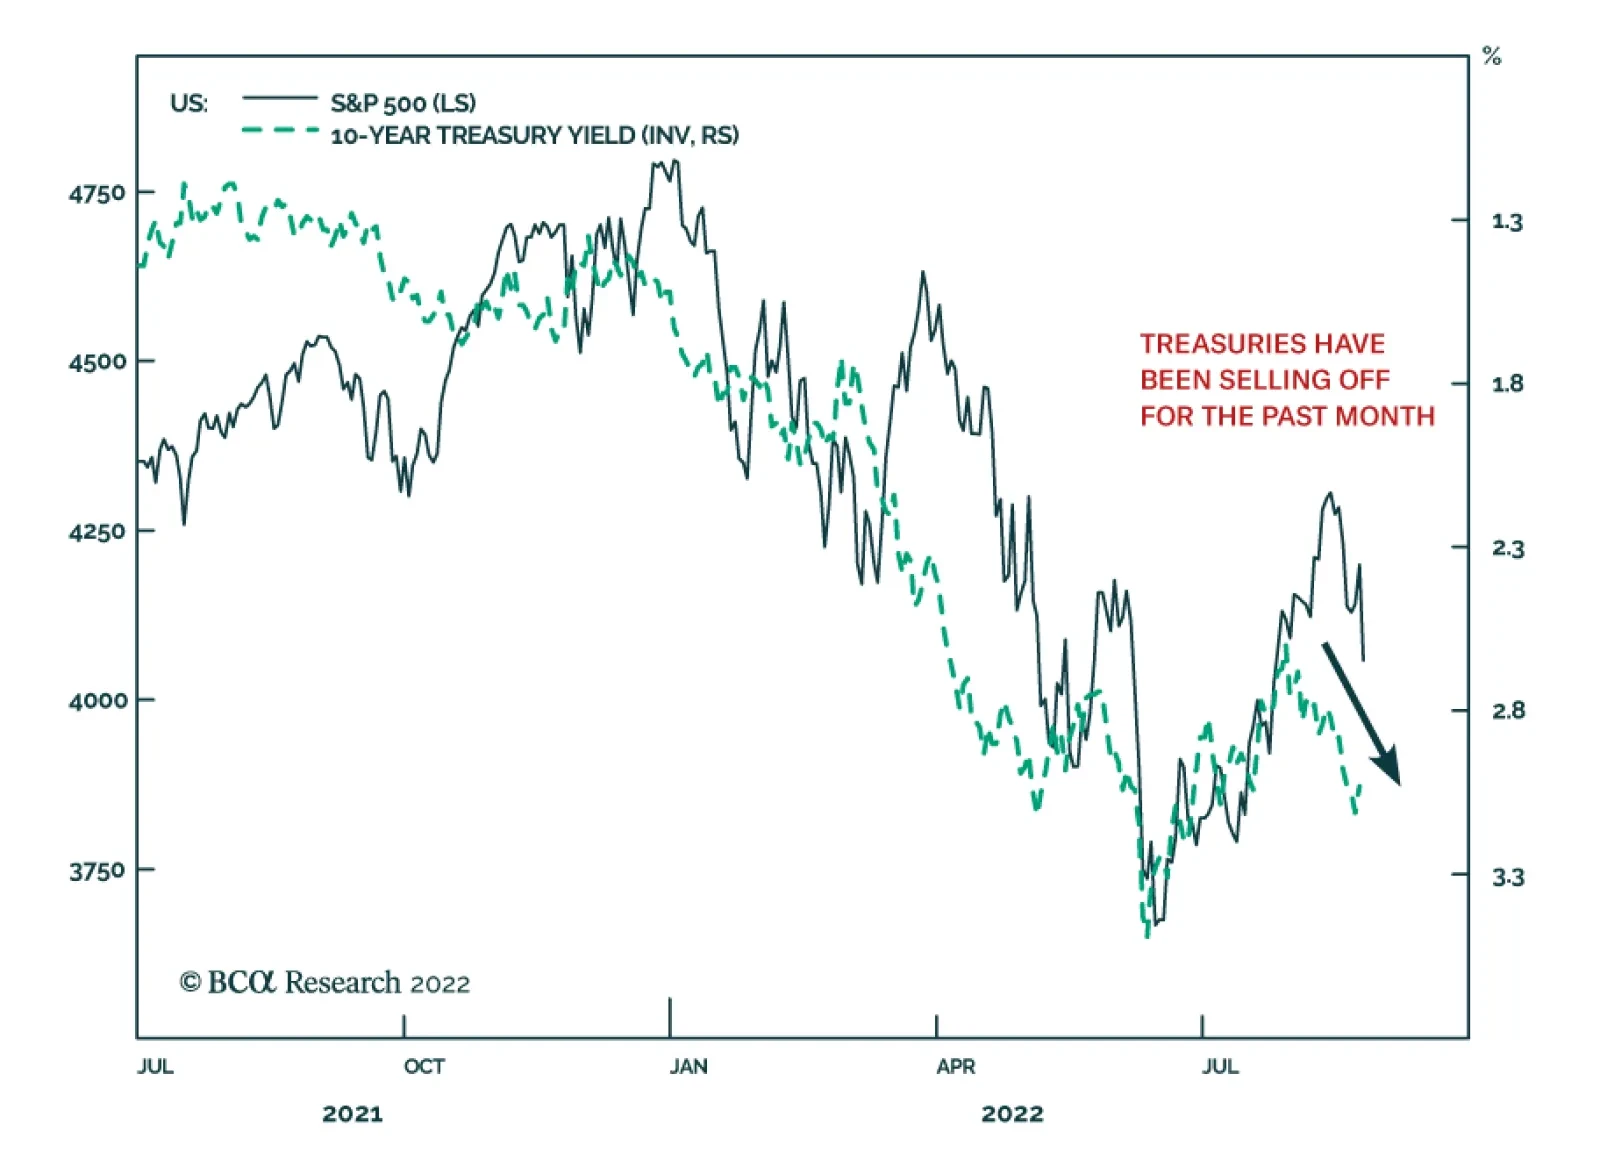
Over the past couple of trading sessions, equities around the world have been under downwards pressure as they digest the hawkish commentary from central bankers at the Jackson Hole Symposium. The S&P 500 and Euro Stoxx 50 are down by 4% and 2.8%…
Executive Summary Reshoring And FDI Job Creation Have Accelerated After The Pandemic
Industrials: A Trifecta Of Positives
Industrials: A Trifecta Of Positives
The US is entering a period of an industrial boom thanks to limited manufacturing capacity paired with strong demand for industrial and consumer goods. In addition, a trifecta of positive developments is further boosting US manufacturing: Onshoring, automation, and fiscal stimulus. Onshoring has accelerated after the onset of the pandemic and reshoring announcements are growing steadily. Automation and robotization allow industrial companies to circumvent labor shortages and rising wages and, hence, boost their profit margins. The domestic political landscape in the US is also favorable for industrial stocks given the three major legislative Acts (Infrastructure Investment & Jobs, Inflation Reduction, and National Defense Authorization) that will secure a healthy demand pipeline. While long-term trends are favorable for the sector, a macroeconomic backdrop of slowing growth is a headwind. However, thanks to a confluence of positive long-term trends, most companies are optimistic. Bottom Line: The US industrial sector is in the middle of a boom fueled by onshoring, automation, and favorable government policy. This trifecta of positives helps the sector to defy the gravity of the slowing economy. We remain overweight Industrials on both tactical and strategical time horizons but will continue to monitor it closely, watching out for potential cracks in operating performance. Feature A little over a year ago EMS, GIS, and USES co-published a report “Industrials as equity sector winner in the coming years”. In that report, we posited that the Industrial sector is poised for outperformance as it enjoys a boom thanks to strong new trends in onshoring and automation. In addition to the tectonic shifts described above, the sector has also found itself at the epicenter of the US legislative activity, which will provide a significant tailwind for its performance. Since we published the report on July 30, 2021, Industrials have performed in line with the S&P 500. However, since the beginning of the year, Industrials and Capital Goods outperformed the index by 7%, showing impressive resilience (Chart 1 and Table 1). Chart 1A Resilient Cyclical Sector
A Resilient Cyclical Sector
A Resilient Cyclical Sector
In this week’s report, we take a close look at the trends highlighted above and conduct a deep dive to evaluate whether the sector is still attractive on a tactical basis considering the backdrop of rising rates and slowing economic activity. Our focus is on the Industrial sector in general, and the Capital Goods Industry Group, in particular. We will also assess which industries are best positioned for outperformance. Table 1Industrials Outperformed On The Way Down And During The Summer Rally
Industrials: A Trifecta Of Positives
Industrials: A Trifecta Of Positives
Sneak Preview: The US industrial sector is in the middle of a boom fueled by onshoring, automation, and favorable government policy. This trifecta of positives helps the sector to defy the gravity of the slowing economy. For now, we are both strategically and tactically bullish on the sector but remain vigilant. US Manufacturing Capacity Has Been Severely Limited For Years US manufacturing capacity has been stagnant over the past 20 years, and the level of US manufacturing employment has declined by 30% since 2000 (Charts 2 & 3). Presently, manufacturing employment accounts for only 8% of total US employment. Chart 2US Manufacturing Employment Has Been Shrinking For Decades
US Manufacturing Employment Has Been Shrinking For Decades
US Manufacturing Employment Has Been Shrinking For Decades
Chart 3US Manufacturing Capacity Has Not Expanded In The Past Two Decades
US Manufacturing Capacity Has Not Expanded In The Past Two Decades
US Manufacturing Capacity Has Not Expanded In The Past Two Decades
The reason for the lack of capacity expansion over the past 20 years has been the outsourcing and shifting of production to other countries, especially China. The peak in US manufacturing capacity and employment occurred after the massive Asian currency devaluation in 1998 and China’s WTO admission in 2001. The semiconductor sector, which has recently come into the limelight, is a case in point: From 1990 to 2020, the percentage of chips manufactured in the US has fallen from 37% to 10%, with the lion’s share of chips manufactured in Asia. This trend has brought about The Chips Act which seeks to reverse the trend for national security reasons. Notably, more recently, the decline in manufacturing capacity and employment has started to reverse. More about this later. American Manufacturing Is Booming Again Limited manufacturing capacity paired with a strong demand for industrial and consumer goods translates into an industrial boom. Industrial companies are incentivized to expand given they are already operating at nearly full capacity (Chart 4) and enjoying considerable pricing power. Building industrial capacity in itself lifts demand for industrial goods and the US may be in the early innings of the new Capex cycle, unless the trend is derailed by headwinds from a significantly tighter monetary policy. After all, the age of US capital stock, at 24 years, is two years older than at previous peaks, indicating that many companies are overdue for replacing some of their equipment and machinery (Chart 5). Chart 4Industrial Companies Operate At Nearly Full Capacity
Industrial Companies Operate At Nearly Full Capacity
Industrial Companies Operate At Nearly Full Capacity
Chart 5The US Capital Stock Has To Be Renewed
The US Capital Stock Has To Be Renewed
The US Capital Stock Has To Be Renewed
Indeed, this may already be happening. According to S&P Dow Jones Indices, which analyzed second-quarter earnings season data, capital expenditures of the companies in the S&P 500, have been growing at a faster pace than stock repurchases for the first time since the first quarter of 2021, rising by 20% from a year earlier. Companies from Pepsi to Google to GM are investing in their production capacity, which in itself may be an encouraging sign that they are comfortable with the demand outlook. Of course, the caveat here is that industrials are late in cycle performance, as companies usually wait towards the end of the cycle to expand, only to find waning demand for their products. You Say “Reshoring,” I Say “Onshoring” A multi-decade decline in US manufacturing employment has started to reverse after the GFC, with the onset of the pandemic and geopolitical tensions accelerating the pace of reshoring and Foreign Direct Investing (FDI). Reshoring and FDI job announcements have increased from 6K in 2010 to 345K in 2022 (Chart 6). The resulting cumulative 950,000 incremental hires represent about 7% of US manufacturing employment. The acceleration of jobs coming back combined with the decline in the rate of offshoring has resulted in a 12-year steady uptrend in US manufacturing jobs. Truly amazing! Onshoring remains on top of mind for companies’ management. According to Statista, mentions of onshoring buzzwords in earnings calls and presentations of US public companies have increased from about 100 throughout 2020 to nearly 200 in Q2-2020. Chart 6Reshoring And FDI Job Creation Have Accelerated After The Pandemic
Industrials: A Trifecta Of Positives
Industrials: A Trifecta Of Positives
According to Morgan Stanley’s survey of more than 400 executives of large corporations from the US to Germany to Japan, the most important factor in supply chain decisions is geopolitical stability, followed by skilled labor, physical infrastructure, and a developed supply chain ecosystem. On nearly every count, the US outranked Europe, China, and Mexico. Some 18% of the companies planned to significantly expand US manufacturing in the next 12 months, while 36% anticipated doing so within three years. More than 40% of US companies were taking steps to “onshore” supply chains. The reasons are well publicized: The COVID crisis has revealed over-dependence on imports. China’s decoupling from the US, tensions in the Taiwan Strait, and the Russian/Ukraine war have invoked concerns about the reliability of the existing supply chains. Supply chain disruptions have highlighted corporate vulnerabilities and had made companies realize that “just-in-case” trumps “just-in-time.” The US is pursuing protectionist policies that are to benefit companies operating in the US, Mexico, and Canada. According to Reshoring Initiative,1 Industrial and Tech companies are at the forefront of reshoring: Electrical Equipment, Chemicals, Transportation Equipment, Computer, and Electronic Products, and Medical Equipment suppliers are the leaders in onshoring (Table 2). Many large manufacturers such as Caterpillar have implemented or announced plans to bring offshore manufacturing back to the US. Table 2Reshoring Jobs By Top 5 Industries
Industrials: A Trifecta Of Positives
Industrials: A Trifecta Of Positives
Will onshoring benefit some of the former manufacturing hubs? We believe it will, as Kentucky, North Carolina, Georgia, Ohio, and Alabama are the top five destinations (Table 3). However, there is a hitch. The US unemployment rate, which is at an all-time low of 3.5%, is certainly a speed limit. Moreover, companies that bring their businesses back home do realize that labor costs in this country are many times higher than, say, in Asia. Hence, one of the solutions they pursue is automation. After many years in the making, onshoring is finally gaining pace, benefiting the US manufacturing base. Table 32022 Projected Reshoring Jobs By Top 10 States
Industrials: A Trifecta Of Positives
Industrials: A Trifecta Of Positives
Automation To The Rescue! The Pace of Robotization And Automation Is Accelerating A critical constraint for the expansion of US manufacturing is the labor shortage. Open vacancies in manufacturing are now at a record high, 100% above the 2018 peak (Chart 7, top panel). Notably, industrial companies have been experiencing difficulties hiring qualified staff over the past 10 years which has led to high wage growth (Chart 7, bottom panel). Chart 7US Manufacturers Cannot Fill Vacant Positions, Wages Are Surging
US Manufacturers Cannot Fill Vacant Positions, Wages Are Surging
US Manufacturers Cannot Fill Vacant Positions, Wages Are Surging
Chart 8Automation Expands Profits Margins Of Global Industrials
Automation Expands Profits Margins Of Global Industrials
Automation Expands Profits Margins Of Global Industrials
One remedy is automation. Replacing labor with automation/robots allows companies to produce more and avoid a profit margin squeeze (Chart 8). In a recent report published by the International Federation of Robotics, industrial robots reported record preliminary sales in 2021 with 486,800 units shipped globally, a 27% increase from 2020. The US has been lagging behind other developed countries in terms of automation and robotization (Chart 9). However, labor shortages brought about by the pandemic appear to have “moved the needle.” According to the Association for Advancing Automation (A3),2 the number of robots sold in the US in 2021 rose by 27% over 2020 with 49,900 units installed. 2022 is on pace to exceed previous records, with North American companies ordering a record 11,595 robots. Chart 9US Has Been Lagging Other Developed Nations In Robot Installations
Industrials: A Trifecta Of Positives
Industrials: A Trifecta Of Positives
Non-automotive sales now represent 58% of the total, demonstrating a broadening reach of automation. Metals, Auto, and Food and Consumer Goods have the highest growth in the purchase of robots (Chart 10). Chart 10In 2021 The Pace Of Robot Installation Has Picked Up
Industrials: A Trifecta Of Positives
Industrials: A Trifecta Of Positives
Implications For Industrial Companies The Industrials sector is home to companies that create robots and offer automation solutions as well as companies on the receiving end of the trend. Both sellers and buyers are to benefit: Buyers Of Robots: Manufacturing companies automating production and enlisting robots into their operations will enjoy higher operating leverage, lower labor costs, and more resilient margins. It is easier to automate processes in manufacturing than in service sectors. Consequently, we believe profit margins in manufacturing will outperform those of service sector companies, where automation will be slower. Sellers Of Robots: The sizzling demand for robots demonstrates that technological breakthroughs are no longer just about the Tech companies, and many industrial companies are to benefit from these nascent trends. Rockwell Automation, Eaton, and Caterpillar are the leaders in industrial automation. These companies also reach across the aisle to software companies to leverage their expertise in data storage, computing, and artificial intelligence. Rockwell has just recently partnered with Microsoft, while others are acquiring software companies. Deere has acquired GUSS Automation, a pioneer in semi-autonomous springs for high-value crops. These companies are to benefit from strong demand for their products and should exhibit strong sales and profit growth. To meet strong demand, industrial/manufacturing companies will automate their processes. This will allow them to boost volume and cap costs resulting in widening profit margins. Uncle Sam Loves American Manufacturing Both Biden and Trump before him, have stated that their overarching objective is to revive America’s manufacturing. However, their methods were drastically different, with Trump introducing tax cuts and tariffs, while Biden leans heavily on fiscal stimulus. The following is a recap of some of the recent laws passed by Congress and signed by President Biden. Infrastructure Investment And Jobs Act The $1.2-trillion Infrastructure Investment and Jobs Act will increase US government non-defense spending to bring it to around 3% of GDP, a level comparable to the 1980s-90s and larger than the 2010s. The bill’s focus is on traditional infrastructure – roads, bridges, ports, and electrical grid modernization – but also includes more modern elements such as $65 billion for 5G broadband Internet and $36 billion for electric vehicles and environmental remediation (Table 4). Implementation of the bill is delayed to 2023-24. Table 4Itemized Infrastructure Plan
Industrials: A Trifecta Of Positives
Industrials: A Trifecta Of Positives
However, the market is forward-looking and companies in Construction & Engineering, and Building Products industries are already winners, and are up 12% in relative terms since the bill was passed on November 15, 2021. The potential increase in public construction will help offset a slump in residential construction on the back of the softening housing market (Chart 11). Chart 11The Increase In Public Construction Will Help Offset A Slump In Residential Construction
The Increase In Public Construction Will Help Offset A Slump In Residential Construction
The Increase In Public Construction Will Help Offset A Slump In Residential Construction
Inflation Reduction Act (IRA) The bill earmarks $370 billion for clean energy spending as well as EV tax credits for both new and used cars. We have written on the topic of “Green and Clean” and the effect of the IRA on renewable energy and EV industries, two industries that are major beneficiaries of the bill. However, the bill also creates an enormous opportunity for industrial companies, which can build and service renewable infrastructure, such as Quanta Services (PWR) and Eaton (ETN). Companies that produce and service wind turbines (GE) and solar batteries will also get a revenue boost from the package. Chips Act Congress has passed the CHIPS+ bill to alleviate the chip shortage and shore up US competitiveness with China. Money is earmarked for domestic semiconductor production and research, and factory construction. While the key beneficiaries are chip foundries, construction of new factories will require equipment and services of a wide range from industrial companies from Construction to Machinery. National Defense Authorization Act In December, the House and Senate Armed Services Committee leadership released the Fiscal Year 2022 National Defense Authorization Act (NDAA). This bill introduces an overall discretionary authorization of $768.2 billion including $740.3 billion for base Department of Defense programs and $27.8 billion for national security programs in the Department of Energy. At a later date, another $37 billion was amended to the bill to include $2.5 billion to help pay higher fuel costs; $550 million for Ukraine, funding for five ships, eight Boeing Co-made F-18 Super Hornet fighter jets, and five Lockheed Martin C-130 Hercules planes; and about $1 billion for four Patriot missile units. For FY 2023, the House has already passed $839 billion, which is $37 billion above the White House request. The Senate will work on the bill after the summer recess. But it is already clear that defense spending has become a bipartisan issue. The increase in the defense budget, as well as additional allocation of funds towards Ukraine, have been a major boost for the Aerospace and Defense industry. We overweighted the sector back in January and it is up 24% in relative terms. Overweight Or Not, That Is The Question Macroeconomic Backdrop Business Cycle: Performance of the Industrial sector tends to lag the business cycle, as sector customers tend to wait until they are sure of recovery and have high utilization of their existing capacity before they expand their own production. However, demand is not entirely cyclical, as the need to replace obsolete or aging equipment or machines is relatively stable. There is also a stark difference in behavior of the largest industrial companies and smaller companies in their ecosystems. Larger manufacturers are long-cycle as it takes months to build machines, planes, or equipment. These companies are less sensitive to the business cycle. On the other hand, their suppliers are “short cycle” as they sell parts to many customers, turn their inventory frequently, and are very sensitive to the economic condition. At present, as economic growth is slowing, long-cycle industrial companies are preferable to short-cycle ones. Despite a bifurcation in demand, Industrials tend to underperform in a generic economic slowdown (Chart 12). This is unsurprising as the relative performance of Industrials is correlated to industrial production and the ISM PMI (Chart 13). Chart 12Historically, Industrials Underperformed During The Slowdown Stage Of The Business Cycle
Industrials: A Trifecta Of Positives
Industrials: A Trifecta Of Positives
Chart 13Industrials Usually Underperform When IP And ISM PMI Decline
Industrials Usually Underperform When IP And ISM PMI Decline
Industrials Usually Underperform When IP And ISM PMI Decline
Chart 14Survey Of Capex Intentions Is Weakening
Survey Of Capex Intentions Is Weakening
Survey Of Capex Intentions Is Weakening
And while we touted the beginning of the new industrial boom in the US, and a brand new Capex cycle, we need to monitor it carefully, as multiple surveys of Capex intentions are decelerating (Chart 14). Tighter Monetary Policy: Another potential headwind comes from rising rates. After all, the higher cost of corporate borrowing may weigh on demand for industrial goods. However, historically, US industrial stocks outperformed the S&P 500 Index in the past 70 years during periods of rising bond yields, including the inflation decade of the 1970s (Chart 15). Industrial companies are well positioned to withstand inflation as strong pricing power allows them to pass on their costs to customers. Chart 15When Rates Rise, Industrials Outperform
When Rates Rise, Industrials Outperform
When Rates Rise, Industrials Outperform
The macroeconomic backdrop presents challenges to Industrial companies Fundamentals Are Strong Significant Pricing Power: While dangers are looming in the macroeconomic backdrop, so far industrial companies have been doing well thanks to their significant pricing power (Chart 16), which they enjoy due to high capacity utilization. The relationship between capacity utilization and selling prices is not linear but exponential. When capacity reaches its limit and shortages arise, potential buyers will likely be willing to pay considerably higher prices to secure the supply of goods that they require. High Operating Leverage: In addition to high pricing power, industrial companies enjoy high operating leverage, which implies that while the economy is growing, even if at a slower pace, they can easily convert sales into profits. This will not be the case when the economy is outright contracting – then high operating leverage will become a liability. Chart 16Industrials Enjoy Substantial Pricing Power
Industrials Enjoy Substantial Pricing Power
Industrials Enjoy Substantial Pricing Power
Strong Q2-2022 Earnings And Sales Results: This explains the strong Q2-2022 sales and earnings results of the Industrial sector. Industrial earnings grew at 17.4%, while its sales increased by 13.3% – a remarkable feat, considering that many companies, especially consumer-facing ones, are struggling with shrinking profitability – earnings growth of the Consumer Discretionary sector was down 12.6%. Clearly, business-to-business companies are faring much better than consumer-facing ones, whose demand was pulled forward by the pandemic, and whose customers are reeling from rising prices and are tightening their belts. Looking ahead, margins are expected to shrink by 0.5% (Chart 17), which is modest compared to the 2.5% contraction expected for the S&P 500. In terms of earnings growth expectations, they have fallen but still exceed the market by an impressive 10% even after a series of downgrades. Importantly, earnings growth in real terms is also positive (Charts 18 & 19). Chart 17Operating Margins Are Expected To Hold Up Well
Operating Margins Are Expected To Hold Up Well
Operating Margins Are Expected To Hold Up Well
Chart 18Industrial Earnings Will Grow Faster Than The Market
Industrial Earnings Will Grow Faster Than The Market
Industrial Earnings Will Grow Faster Than The Market
Chart 19Earnings Expectations Have Been Re-calibrated
Earnings Expectations Have Been Re-calibrated
Earnings Expectations Have Been Re-calibrated
What Companies Are Saying All the charts and numbers align well with what we have heard from companies during the earnings season. For instance, nearly every major player within its own respective sub-industry reported healthy demand, low inventories, and a hefty backlog this quarter. Here are a few quotes from the largest players: Caterpillar (CAT): “We expect production and utilization levels will remain elevated, and our autonomous solutions continued to gain momentum … overall demand remained healthy across our segments … was unable to completely satisfy strong customer demand for our machines and engines.” MMM: “Continued strong demand for our solutions in semiconductor, factory automation, and automotive end markets.” GE: “In Renewables, … we are making progress. Our pricing has substantially improved onshore … we're growing our higher-margin businesses, such as grid automation, which delivered double-digit orders growth.” Honeywell (HON): “Orders were up 12% year over year and closing backlog was also up 12% year over year.” The profitability of the Industrial sector is expected to be resilient and to better the market. Valuations And Technicals The Industrial sector and the Capital Goods Industry group trade on par with the S&P 500 on a forward earnings basis (17.7x and 17.9x to 18.0x). The BCA Valuations Indicator signals a neutral level of valuation which is roughly in line with the 10-year average. From the BCA Technical Indicator standpoint, Capitals Goods are also in the neutral zone (Chart 20). Valuations and technicals are moderate for the sector. Chart 20Valuations And Technicals
Valuations And Technicals
Valuations And Technicals
Investment Implications The US industrial sector is in the middle of a boom fueled by a trifecta of positives: Onshoring, automation, and favorable government policy. And while it is hard to fight the Fed and the business cycle, it appears that for now, the sector is defying gravity despite slowing manufacturing surveys and tighter monetary policy. So far fundamentals appear strong, and earnings expectations are robust thanks to the high pricing power and operating leverage of the sector. Within Capital Goods, we favor industries and companies that benefit from these tailwinds: Aerospace and Defense which is to benefit from increased federal defense spending; Robotics and Automation which is overrepresented in the Electrical Equipment industry; and Renewables, i.e., companies that manufacture and service wind turbines and solar panels. Construction and building materials will have a second breath when Infrastructure spending projects will actually get selected and approved. We are both strategically and tactically bullish on the sector but will monitor it closely from a tactical standpoint. After all, industrial surveys are at odds with the resilient earnings expectations. ETFs There are a number of very inexpensive and highly liquid ETFs from Vanguard, iShares, and State Street, that capture the performance of the Industrial sector (Table 5). Table 5Industrial Sector ETFs
Industrials: A Trifecta Of Positives
Industrials: A Trifecta Of Positives
Bottom Line The US industrial sector is in the middle of a boom fueled by onshoring, automation, and favorable government policy. This trifecta of positives helps the sector to defy the gravity of the slowing economy. Companies are optimistic and earnings growth expectations are both robust and resilient. We are both strategically and tactically bullish on the sector but will continue to monitor it closely, watching out for potential cracks in operating performance. Irene Tunkel Chief Strategist, US Equity Strategy irene.tunkel@bcaresearch.com Footnotes 1 Reshoring Initiative reshorenow.org 2 https://www.automate.org/ Recommended Allocation Recommended Allocation: Addendum
What Our Clients Are Asking: The Bear Market 2.0 Webcast Follow Up
What Our Clients Are Asking: The Bear Market 2.0 Webcast Follow Up
Executive Summary Reshoring And FDI Job Creation Have Accelerated After The Pandemic
Industrials: A Trifecta Of Positives
Industrials: A Trifecta Of Positives
The US is entering a period of an industrial boom thanks to limited manufacturing capacity paired with strong demand for industrial and consumer goods. In addition, a trifecta of positive developments is further boosting US manufacturing: Onshoring, automation, and fiscal stimulus. Onshoring has accelerated after the onset of the pandemic and reshoring announcements are growing steadily. Automation and robotization allow industrial companies to circumvent labor shortages and rising wages and, hence, boost their profit margins. The domestic political landscape in the US is also favorable for industrial stocks given the three major legislative Acts (Infrastructure Investment & Jobs, Inflation Reduction, and National Defense Authorization) that will secure a healthy demand pipeline. While long-term trends are favorable for the sector, a macroeconomic backdrop of slowing growth is a headwind. However, thanks to a confluence of positive long-term trends, most companies are optimistic. Bottom Line: The US industrial sector is in the middle of a boom fueled by onshoring, automation, and favorable government policy. This trifecta of positives helps the sector to defy the gravity of the slowing economy. We remain overweight Industrials on both tactical and strategical time horizons but will continue to monitor it closely, watching out for potential cracks in operating performance. Feature A little over a year ago EMS, GIS, and USES co-published a report “Industrials as equity sector winner in the coming years”. In that report, we posited that the Industrial sector is poised for outperformance as it enjoys a boom thanks to strong new trends in onshoring and automation. In addition to the tectonic shifts described above, the sector has also found itself at the epicenter of the US legislative activity, which will provide a significant tailwind for its performance. Since we published the report on July 30, 2021, Industrials have performed in line with the S&P 500. However, since the beginning of the year, Industrials and Capital Goods outperformed the index by 7%, showing impressive resilience (Chart 1 and Table 1). Chart 1A Resilient Cyclical Sector
A Resilient Cyclical Sector
A Resilient Cyclical Sector
In this week’s report, we take a close look at the trends highlighted above and conduct a deep dive to evaluate whether the sector is still attractive on a tactical basis considering the backdrop of rising rates and slowing economic activity. Our focus is on the Industrial sector in general, and the Capital Goods Industry Group, in particular. We will also assess which industries are best positioned for outperformance. Table 1Industrials Outperformed On The Way Down And During The Summer Rally
Industrials: A Trifecta Of Positives
Industrials: A Trifecta Of Positives
Sneak Preview: The US industrial sector is in the middle of a boom fueled by onshoring, automation, and favorable government policy. This trifecta of positives helps the sector to defy the gravity of the slowing economy. For now, we are both strategically and tactically bullish on the sector but remain vigilant. US Manufacturing Capacity Has Been Severely Limited For Years US manufacturing capacity has been stagnant over the past 20 years, and the level of US manufacturing employment has declined by 30% since 2000 (Charts 2 & 3). Presently, manufacturing employment accounts for only 8% of total US employment. Chart 2US Manufacturing Employment Has Been Shrinking For Decades
US Manufacturing Employment Has Been Shrinking For Decades
US Manufacturing Employment Has Been Shrinking For Decades
Chart 3US Manufacturing Capacity Has Not Expanded In The Past Two Decades
US Manufacturing Capacity Has Not Expanded In The Past Two Decades
US Manufacturing Capacity Has Not Expanded In The Past Two Decades
The reason for the lack of capacity expansion over the past 20 years has been the outsourcing and shifting of production to other countries, especially China. The peak in US manufacturing capacity and employment occurred after the massive Asian currency devaluation in 1998 and China’s WTO admission in 2001. The semiconductor sector, which has recently come into the limelight, is a case in point: From 1990 to 2020, the percentage of chips manufactured in the US has fallen from 37% to 10%, with the lion’s share of chips manufactured in Asia. This trend has brought about The Chips Act which seeks to reverse the trend for national security reasons. Notably, more recently, the decline in manufacturing capacity and employment has started to reverse. More about this later. American Manufacturing Is Booming Again Limited manufacturing capacity paired with a strong demand for industrial and consumer goods translates into an industrial boom. Industrial companies are incentivized to expand given they are already operating at nearly full capacity (Chart 4) and enjoying considerable pricing power. Building industrial capacity in itself lifts demand for industrial goods and the US may be in the early innings of the new Capex cycle, unless the trend is derailed by headwinds from a significantly tighter monetary policy. After all, the age of US capital stock, at 24 years, is two years older than at previous peaks, indicating that many companies are overdue for replacing some of their equipment and machinery (Chart 5). Chart 4Industrial Companies Operate At Nearly Full Capacity
Industrial Companies Operate At Nearly Full Capacity
Industrial Companies Operate At Nearly Full Capacity
Chart 5The US Capital Stock Has To Be Renewed
The US Capital Stock Has To Be Renewed
The US Capital Stock Has To Be Renewed
Indeed, this may already be happening. According to S&P Dow Jones Indices, which analyzed second-quarter earnings season data, capital expenditures of the companies in the S&P 500, have been growing at a faster pace than stock repurchases for the first time since the first quarter of 2021, rising by 20% from a year earlier. Companies from Pepsi to Google to GM are investing in their production capacity, which in itself may be an encouraging sign that they are comfortable with the demand outlook. Of course, the caveat here is that industrials are late in cycle performance, as companies usually wait towards the end of the cycle to expand, only to find waning demand for their products. You Say “Reshoring,” I Say “Onshoring” A multi-decade decline in US manufacturing employment has started to reverse after the GFC, with the onset of the pandemic and geopolitical tensions accelerating the pace of reshoring and Foreign Direct Investing (FDI). Reshoring and FDI job announcements have increased from 6K in 2010 to 345K in 2022 (Chart 6). The resulting cumulative 950,000 incremental hires represent about 7% of US manufacturing employment. The acceleration of jobs coming back combined with the decline in the rate of offshoring has resulted in a 12-year steady uptrend in US manufacturing jobs. Truly amazing! Onshoring remains on top of mind for companies’ management. According to Statista, mentions of onshoring buzzwords in earnings calls and presentations of US public companies have increased from about 100 throughout 2020 to nearly 200 in Q2-2020. Chart 6Reshoring And FDI Job Creation Have Accelerated After The Pandemic
Industrials: A Trifecta Of Positives
Industrials: A Trifecta Of Positives
According to Morgan Stanley’s survey of more than 400 executives of large corporations from the US to Germany to Japan, the most important factor in supply chain decisions is geopolitical stability, followed by skilled labor, physical infrastructure, and a developed supply chain ecosystem. On nearly every count, the US outranked Europe, China, and Mexico. Some 18% of the companies planned to significantly expand US manufacturing in the next 12 months, while 36% anticipated doing so within three years. More than 40% of US companies were taking steps to “onshore” supply chains. The reasons are well publicized: The COVID crisis has revealed over-dependence on imports. China’s decoupling from the US, tensions in the Taiwan Strait, and the Russian/Ukraine war have invoked concerns about the reliability of the existing supply chains. Supply chain disruptions have highlighted corporate vulnerabilities and had made companies realize that “just-in-case” trumps “just-in-time.” The US is pursuing protectionist policies that are to benefit companies operating in the US, Mexico, and Canada. According to Reshoring Initiative,1 Industrial and Tech companies are at the forefront of reshoring: Electrical Equipment, Chemicals, Transportation Equipment, Computer, and Electronic Products, and Medical Equipment suppliers are the leaders in onshoring (Table 2). Many large manufacturers such as Caterpillar have implemented or announced plans to bring offshore manufacturing back to the US. Table 2Reshoring Jobs By Top 5 Industries
Industrials: A Trifecta Of Positives
Industrials: A Trifecta Of Positives
Will onshoring benefit some of the former manufacturing hubs? We believe it will, as Kentucky, North Carolina, Georgia, Ohio, and Alabama are the top five destinations (Table 3). However, there is a hitch. The US unemployment rate, which is at an all-time low of 3.5%, is certainly a speed limit. Moreover, companies that bring their businesses back home do realize that labor costs in this country are many times higher than, say, in Asia. Hence, one of the solutions they pursue is automation. After many years in the making, onshoring is finally gaining pace, benefiting the US manufacturing base. Table 32022 Projected Reshoring Jobs By Top 10 States
Industrials: A Trifecta Of Positives
Industrials: A Trifecta Of Positives
Automation To The Rescue! The Pace of Robotization And Automation Is Accelerating A critical constraint for the expansion of US manufacturing is the labor shortage. Open vacancies in manufacturing are now at a record high, 100% above the 2018 peak (Chart 7, top panel). Notably, industrial companies have been experiencing difficulties hiring qualified staff over the past 10 years which has led to high wage growth (Chart 7, bottom panel). Chart 7US Manufacturers Cannot Fill Vacant Positions, Wages Are Surging
US Manufacturers Cannot Fill Vacant Positions, Wages Are Surging
US Manufacturers Cannot Fill Vacant Positions, Wages Are Surging
Chart 8Automation Expands Profits Margins Of Global Industrials
Automation Expands Profits Margins Of Global Industrials
Automation Expands Profits Margins Of Global Industrials
One remedy is automation. Replacing labor with automation/robots allows companies to produce more and avoid a profit margin squeeze (Chart 8). In a recent report published by the International Federation of Robotics, industrial robots reported record preliminary sales in 2021 with 486,800 units shipped globally, a 27% increase from 2020. The US has been lagging behind other developed countries in terms of automation and robotization (Chart 9). However, labor shortages brought about by the pandemic appear to have “moved the needle.” According to the Association for Advancing Automation (A3),2 the number of robots sold in the US in 2021 rose by 27% over 2020 with 49,900 units installed. 2022 is on pace to exceed previous records, with North American companies ordering a record 11,595 robots. Chart 9US Has Been Lagging Other Developed Nations In Robot Installations
Industrials: A Trifecta Of Positives
Industrials: A Trifecta Of Positives
Non-automotive sales now represent 58% of the total, demonstrating a broadening reach of automation. Metals, Auto, and Food and Consumer Goods have the highest growth in the purchase of robots (Chart 10). Chart 10In 2021 The Pace Of Robot Installation Has Picked Up
Industrials: A Trifecta Of Positives
Industrials: A Trifecta Of Positives
Implications For Industrial Companies The Industrials sector is home to companies that create robots and offer automation solutions as well as companies on the receiving end of the trend. Both sellers and buyers are to benefit: Buyers Of Robots: Manufacturing companies automating production and enlisting robots into their operations will enjoy higher operating leverage, lower labor costs, and more resilient margins. It is easier to automate processes in manufacturing than in service sectors. Consequently, we believe profit margins in manufacturing will outperform those of service sector companies, where automation will be slower. Sellers Of Robots: The sizzling demand for robots demonstrates that technological breakthroughs are no longer just about the Tech companies, and many industrial companies are to benefit from these nascent trends. Rockwell Automation, Eaton, and Caterpillar are the leaders in industrial automation. These companies also reach across the aisle to software companies to leverage their expertise in data storage, computing, and artificial intelligence. Rockwell has just recently partnered with Microsoft, while others are acquiring software companies. Deere has acquired GUSS Automation, a pioneer in semi-autonomous springs for high-value crops. These companies are to benefit from strong demand for their products and should exhibit strong sales and profit growth. To meet strong demand, industrial/manufacturing companies will automate their processes. This will allow them to boost volume and cap costs resulting in widening profit margins. Uncle Sam Loves American Manufacturing Both Biden and Trump before him, have stated that their overarching objective is to revive America’s manufacturing. However, their methods were drastically different, with Trump introducing tax cuts and tariffs, while Biden leans heavily on fiscal stimulus. The following is a recap of some of the recent laws passed by Congress and signed by President Biden. Infrastructure Investment And Jobs Act The $1.2-trillion Infrastructure Investment and Jobs Act will increase US government non-defense spending to bring it to around 3% of GDP, a level comparable to the 1980s-90s and larger than the 2010s. The bill’s focus is on traditional infrastructure – roads, bridges, ports, and electrical grid modernization – but also includes more modern elements such as $65 billion for 5G broadband Internet and $36 billion for electric vehicles and environmental remediation (Table 4). Implementation of the bill is delayed to 2023-24. Table 4Itemized Infrastructure Plan
Industrials: A Trifecta Of Positives
Industrials: A Trifecta Of Positives
However, the market is forward-looking and companies in Construction & Engineering, and Building Products industries are already winners, and are up 12% in relative terms since the bill was passed on November 15, 2021. The potential increase in public construction will help offset a slump in residential construction on the back of the softening housing market (Chart 11). Chart 11The Increase In Public Construction Will Help Offset A Slump In Residential Construction
The Increase In Public Construction Will Help Offset A Slump In Residential Construction
The Increase In Public Construction Will Help Offset A Slump In Residential Construction
Inflation Reduction Act (IRA) The bill earmarks $370 billion for clean energy spending as well as EV tax credits for both new and used cars. We have written on the topic of “Green and Clean” and the effect of the IRA on renewable energy and EV industries, two industries that are major beneficiaries of the bill. However, the bill also creates an enormous opportunity for industrial companies, which can build and service renewable infrastructure, such as Quanta Services (PWR) and Eaton (ETN). Companies that produce and service wind turbines (GE) and solar batteries will also get a revenue boost from the package. Chips Act Congress has passed the CHIPS+ bill to alleviate the chip shortage and shore up US competitiveness with China. Money is earmarked for domestic semiconductor production and research, and factory construction. While the key beneficiaries are chip foundries, construction of new factories will require equipment and services of a wide range from industrial companies from Construction to Machinery. National Defense Authorization Act In December, the House and Senate Armed Services Committee leadership released the Fiscal Year 2022 National Defense Authorization Act (NDAA). This bill introduces an overall discretionary authorization of $768.2 billion including $740.3 billion for base Department of Defense programs and $27.8 billion for national security programs in the Department of Energy. At a later date, another $37 billion was amended to the bill to include $2.5 billion to help pay higher fuel costs; $550 million for Ukraine, funding for five ships, eight Boeing Co-made F-18 Super Hornet fighter jets, and five Lockheed Martin C-130 Hercules planes; and about $1 billion for four Patriot missile units. For FY 2023, the House has already passed $839 billion, which is $37 billion above the White House request. The Senate will work on the bill after the summer recess. But it is already clear that defense spending has become a bipartisan issue. The increase in the defense budget, as well as additional allocation of funds towards Ukraine, have been a major boost for the Aerospace and Defense industry. We overweighted the sector back in January and it is up 24% in relative terms. Overweight Or Not, That Is The Question Macroeconomic Backdrop Business Cycle: Performance of the Industrial sector tends to lag the business cycle, as sector customers tend to wait until they are sure of recovery and have high utilization of their existing capacity before they expand their own production. However, demand is not entirely cyclical, as the need to replace obsolete or aging equipment or machines is relatively stable. There is also a stark difference in behavior of the largest industrial companies and smaller companies in their ecosystems. Larger manufacturers are long-cycle as it takes months to build machines, planes, or equipment. These companies are less sensitive to the business cycle. On the other hand, their suppliers are “short cycle” as they sell parts to many customers, turn their inventory frequently, and are very sensitive to the economic condition. At present, as economic growth is slowing, long-cycle industrial companies are preferable to short-cycle ones. Despite a bifurcation in demand, Industrials tend to underperform in a generic economic slowdown (Chart 12). This is unsurprising as the relative performance of Industrials is correlated to industrial production and the ISM PMI (Chart 13). Chart 12Historically, Industrials Underperformed During The Slowdown Stage Of The Business Cycle
Industrials: A Trifecta Of Positives
Industrials: A Trifecta Of Positives
Chart 13Industrials Usually Underperform When IP And ISM PMI Decline
Industrials Usually Underperform When IP And ISM PMI Decline
Industrials Usually Underperform When IP And ISM PMI Decline
Chart 14Survey Of Capex Intentions Is Weakening
Survey Of Capex Intentions Is Weakening
Survey Of Capex Intentions Is Weakening
And while we touted the beginning of the new industrial boom in the US, and a brand new Capex cycle, we need to monitor it carefully, as multiple surveys of Capex intentions are decelerating (Chart 14). Tighter Monetary Policy: Another potential headwind comes from rising rates. After all, the higher cost of corporate borrowing may weigh on demand for industrial goods. However, historically, US industrial stocks outperformed the S&P 500 Index in the past 70 years during periods of rising bond yields, including the inflation decade of the 1970s (Chart 15). Industrial companies are well positioned to withstand inflation as strong pricing power allows them to pass on their costs to customers. Chart 15When Rates Rise, Industrials Outperform
When Rates Rise, Industrials Outperform
When Rates Rise, Industrials Outperform
The macroeconomic backdrop presents challenges to Industrial companies Fundamentals Are Strong Significant Pricing Power: While dangers are looming in the macroeconomic backdrop, so far industrial companies have been doing well thanks to their significant pricing power (Chart 16), which they enjoy due to high capacity utilization. The relationship between capacity utilization and selling prices is not linear but exponential. When capacity reaches its limit and shortages arise, potential buyers will likely be willing to pay considerably higher prices to secure the supply of goods that they require. High Operating Leverage: In addition to high pricing power, industrial companies enjoy high operating leverage, which implies that while the economy is growing, even if at a slower pace, they can easily convert sales into profits. This will not be the case when the economy is outright contracting – then high operating leverage will become a liability. Chart 16Industrials Enjoy Substantial Pricing Power
Industrials Enjoy Substantial Pricing Power
Industrials Enjoy Substantial Pricing Power
Strong Q2-2022 Earnings And Sales Results: This explains the strong Q2-2022 sales and earnings results of the Industrial sector. Industrial earnings grew at 17.4%, while its sales increased by 13.3% – a remarkable feat, considering that many companies, especially consumer-facing ones, are struggling with shrinking profitability – earnings growth of the Consumer Discretionary sector was down 12.6%. Clearly, business-to-business companies are faring much better than consumer-facing ones, whose demand was pulled forward by the pandemic, and whose customers are reeling from rising prices and are tightening their belts. Looking ahead, margins are expected to shrink by 0.5% (Chart 17), which is modest compared to the 2.5% contraction expected for the S&P 500. In terms of earnings growth expectations, they have fallen but still exceed the market by an impressive 10% even after a series of downgrades. Importantly, earnings growth in real terms is also positive (Charts 18 & 19). Chart 17Operating Margins Are Expected To Hold Up Well
Operating Margins Are Expected To Hold Up Well
Operating Margins Are Expected To Hold Up Well
Chart 18Industrial Earnings Will Grow Faster Than The Market
Industrial Earnings Will Grow Faster Than The Market
Industrial Earnings Will Grow Faster Than The Market
Chart 19Earnings Expectations Have Been Re-calibrated
Earnings Expectations Have Been Re-calibrated
Earnings Expectations Have Been Re-calibrated
What Companies Are Saying All the charts and numbers align well with what we have heard from companies during the earnings season. For instance, nearly every major player within its own respective sub-industry reported healthy demand, low inventories, and a hefty backlog this quarter. Here are a few quotes from the largest players: Caterpillar (CAT): “We expect production and utilization levels will remain elevated, and our autonomous solutions continued to gain momentum … overall demand remained healthy across our segments … was unable to completely satisfy strong customer demand for our machines and engines.” MMM: “Continued strong demand for our solutions in semiconductor, factory automation, and automotive end markets.” GE: “In Renewables, … we are making progress. Our pricing has substantially improved onshore … we're growing our higher-margin businesses, such as grid automation, which delivered double-digit orders growth.” Honeywell (HON): “Orders were up 12% year over year and closing backlog was also up 12% year over year.” The profitability of the Industrial sector is expected to be resilient and to better the market. Valuations And Technicals The Industrial sector and the Capital Goods Industry group trade on par with the S&P 500 on a forward earnings basis (17.7x and 17.9x to 18.0x). The BCA Valuations Indicator signals a neutral level of valuation which is roughly in line with the 10-year average. From the BCA Technical Indicator standpoint, Capitals Goods are also in the neutral zone (Chart 20). Valuations and technicals are moderate for the sector. Chart 20Valuations And Technicals
Valuations And Technicals
Valuations And Technicals
Investment Implications The US industrial sector is in the middle of a boom fueled by a trifecta of positives: Onshoring, automation, and favorable government policy. And while it is hard to fight the Fed and the business cycle, it appears that for now, the sector is defying gravity despite slowing manufacturing surveys and tighter monetary policy. So far fundamentals appear strong, and earnings expectations are robust thanks to the high pricing power and operating leverage of the sector. Within Capital Goods, we favor industries and companies that benefit from these tailwinds: Aerospace and Defense which is to benefit from increased federal defense spending; Robotics and Automation which is overrepresented in the Electrical Equipment industry; and Renewables, i.e., companies that manufacture and service wind turbines and solar panels. Construction and building materials will have a second breath when Infrastructure spending projects will actually get selected and approved. We are both strategically and tactically bullish on the sector but will monitor it closely from a tactical standpoint. After all, industrial surveys are at odds with the resilient earnings expectations. ETFs There are a number of very inexpensive and highly liquid ETFs from Vanguard, iShares, and State Street, that capture the performance of the Industrial sector (Table 5). Table 5Industrial Sector ETFs
Industrials: A Trifecta Of Positives
Industrials: A Trifecta Of Positives
Bottom Line The US industrial sector is in the middle of a boom fueled by onshoring, automation, and favorable government policy. This trifecta of positives helps the sector to defy the gravity of the slowing economy. Companies are optimistic and earnings growth expectations are both robust and resilient. We are both strategically and tactically bullish on the sector but will continue to monitor it closely, watching out for potential cracks in operating performance. Irene Tunkel Chief Strategist, US Equity Strategy irene.tunkel@bcaresearch.com Footnotes 1 Reshoring Initiative reshorenow.org 2 https://www.automate.org/ Strategic View Open Tactical Positions (0-6 Months) Open Cyclical Recommendations (6-18 Months) Table A2Political Risk Matrix
Industrials: A Trifecta Of Positives
Industrials: A Trifecta Of Positives
Table A3US Political Capital Index
Industrials: A Trifecta Of Positives
Industrials: A Trifecta Of Positives
Chart A1Presidential Election Model
Third Quarter US Political Outlook: Last Ditch Effort
Third Quarter US Political Outlook: Last Ditch Effort
Chart A2Senate Election Model
Third Quarter US Political Outlook: Last Ditch Effort
Third Quarter US Political Outlook: Last Ditch Effort
Table A4House Election Model
Biden's Midterm Tactics Bear Fruit… But There's A Snake
Biden's Midterm Tactics Bear Fruit… But There's A Snake
Table A5APolitical Capital: White House And Congress
Industrials: A Trifecta Of Positives
Industrials: A Trifecta Of Positives
Table A5BPolitical Capital: Household And Business Sentiment
Industrials: A Trifecta Of Positives
Industrials: A Trifecta Of Positives
Table A5CPolitical Capital: The Economy And Markets
Industrials: A Trifecta Of Positives
Industrials: A Trifecta Of Positives
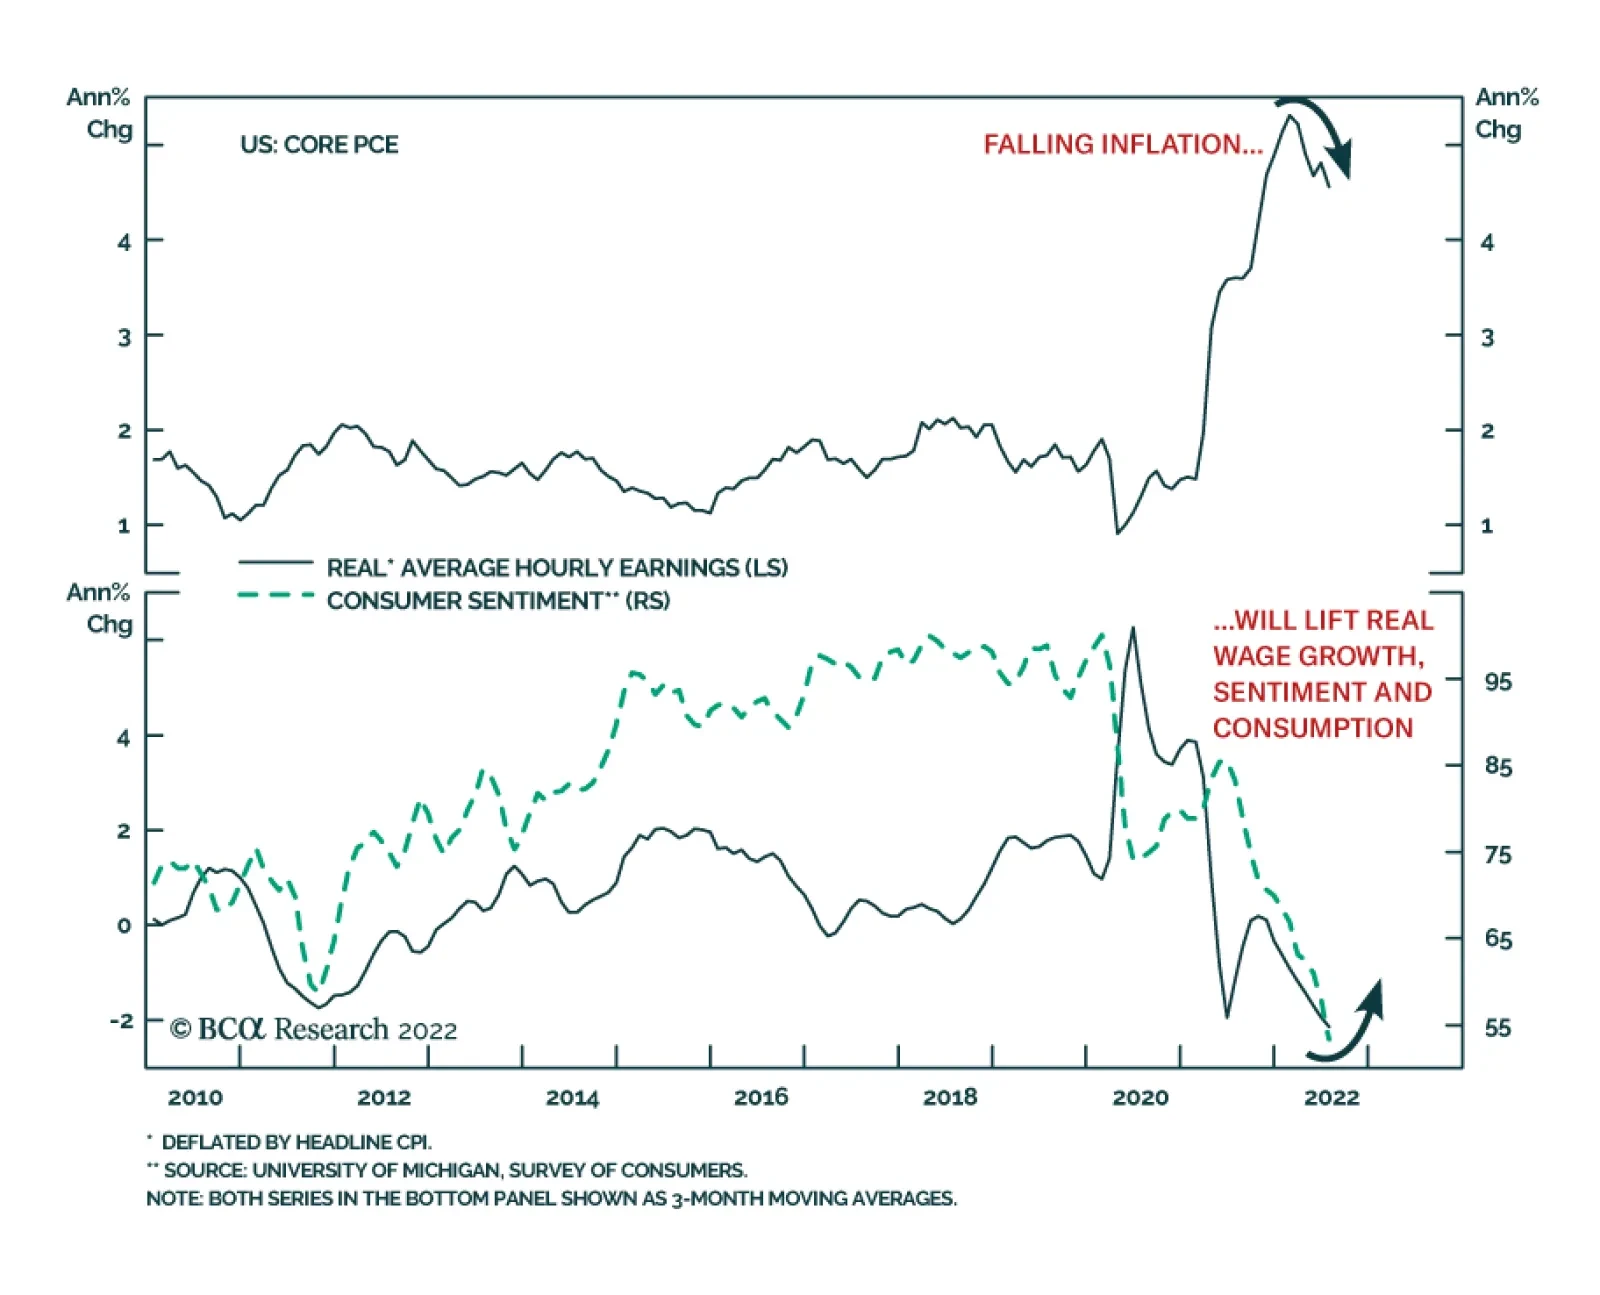
The deceleration in US personal income and spending was larger-than-expected in July. Income and spending grew by 0.2% m/m and 0.1% m/m respectively, following 0.7% and 1.0% increases in June. Core PCE, the Fed’s favored inflation gauge, eased to 4.6% y/y…
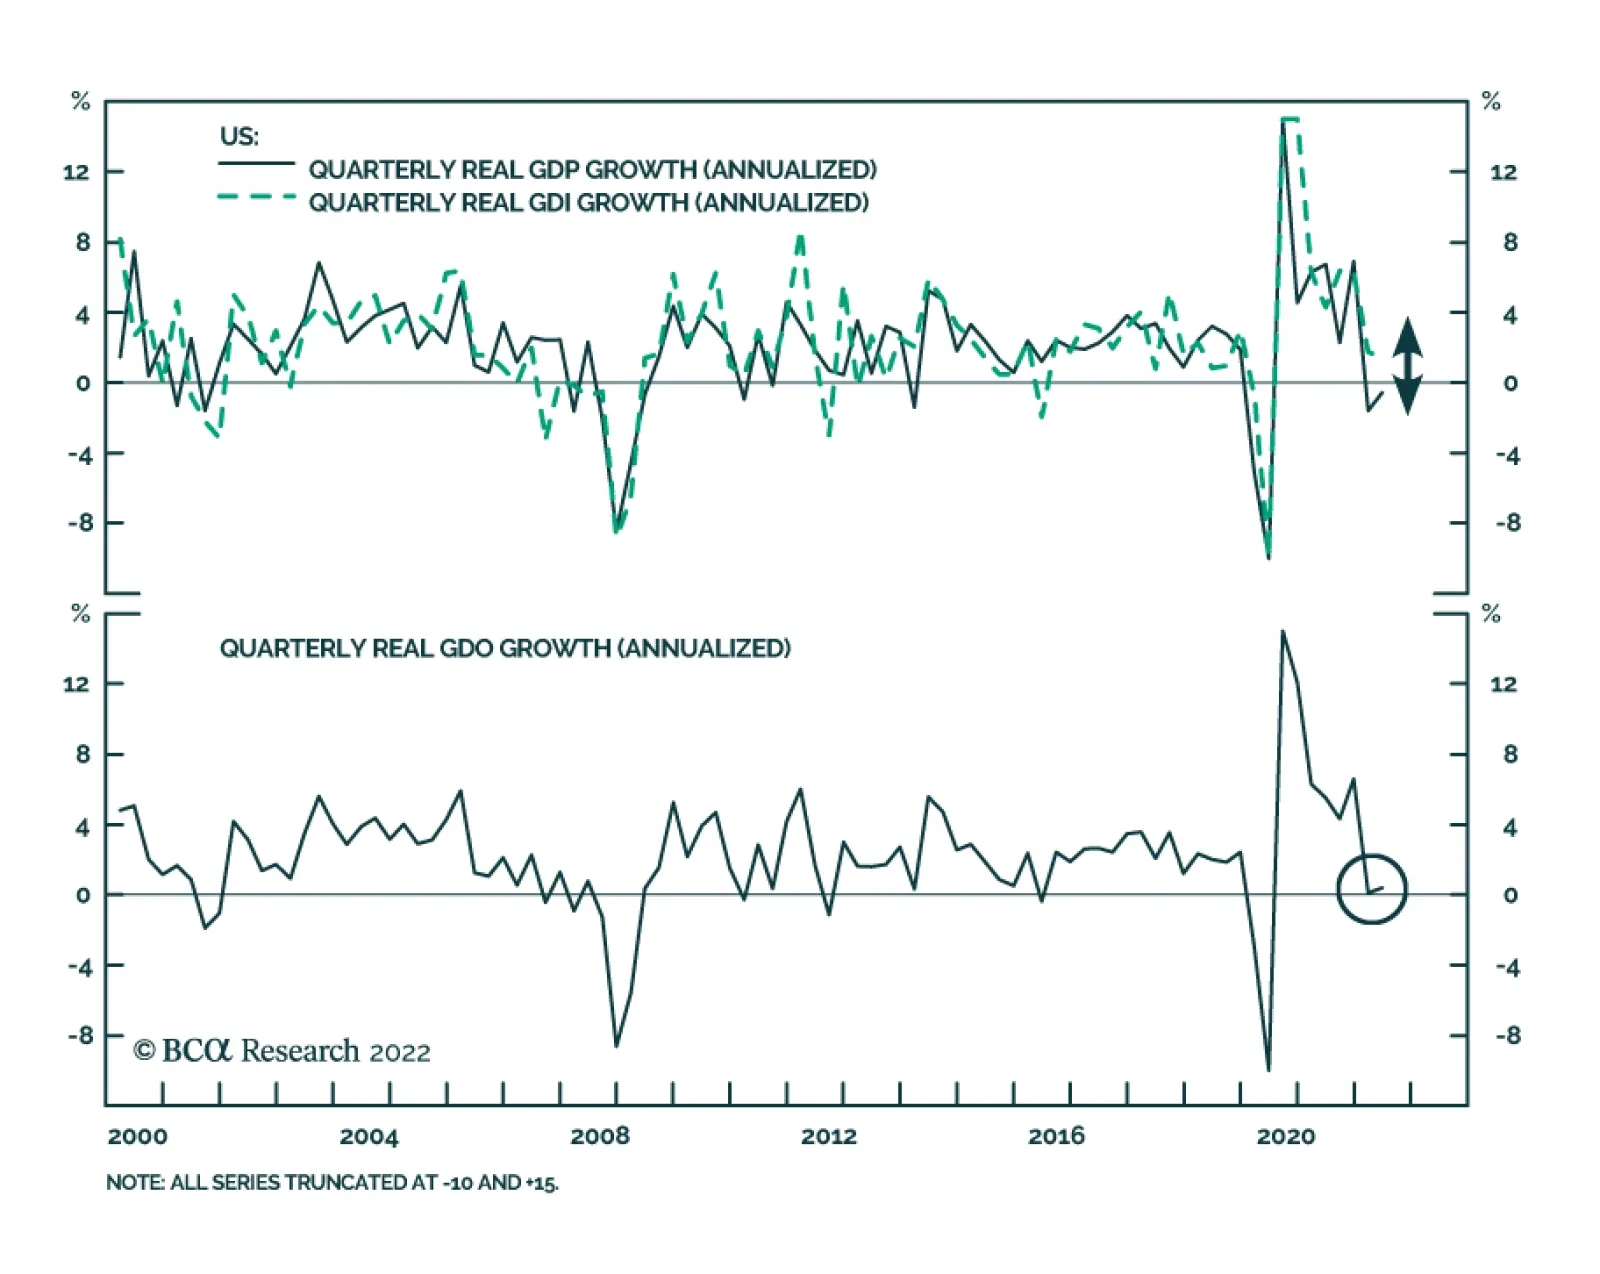
Although US GDP growth was revised up to -0.6% from its preliminary estimate of -0.9%, it continues to point to a contraction in economic activity in Q2. It marks the second consecutive quarter of negative GDP growth – meeting the textbook definition of a…
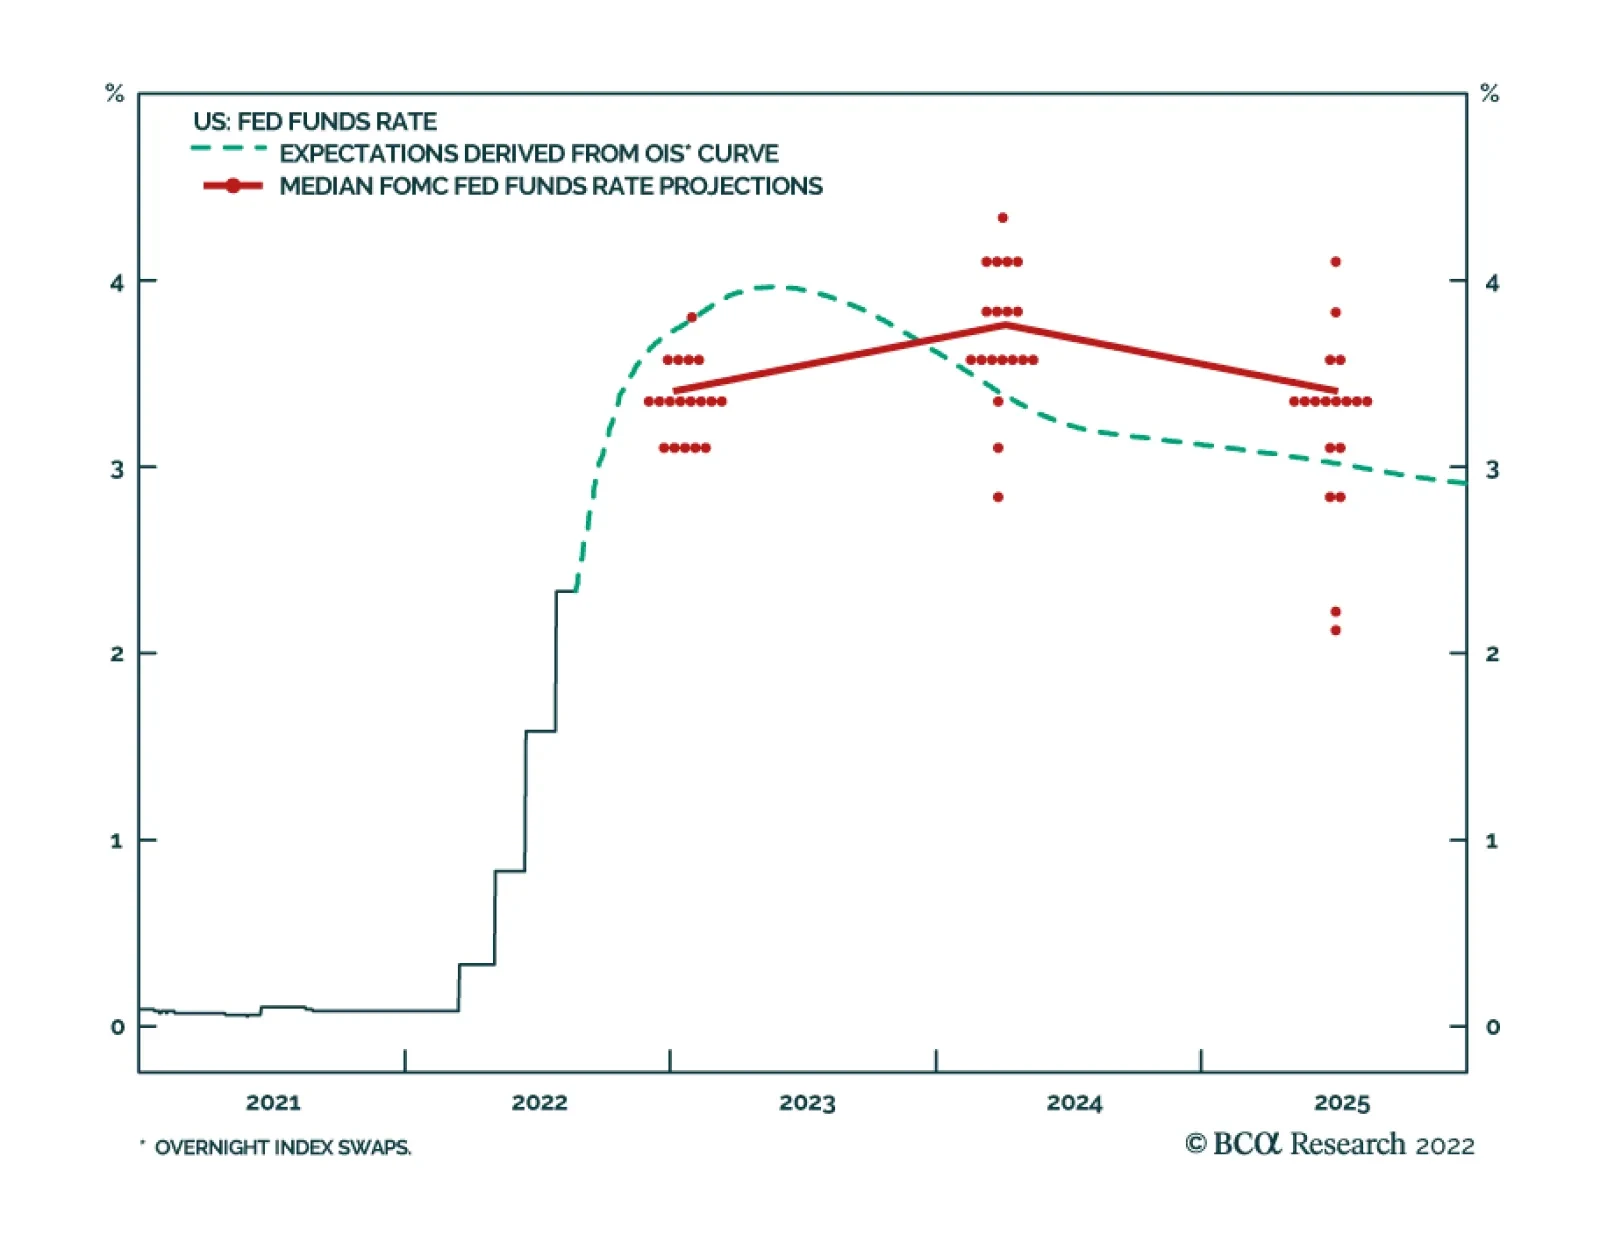
Guidance from Jackson Hole is loud and clear: the central bank is committed to ensuring that inflation returns to target. Powell started his speech by highlighting that the FOMC’s “overarching focus right now is to bring inflation back down to [their] 2…
Listen to a short summary of this report. Executive Summary Housing Activity Should Start To Stabilize By The End Of The Year
Housing Activity Should Start To Stabilize By The End Of The Year
Housing Activity Should Start To Stabilize By The End Of The Year
Home prices in the US are set to decline, almost certainly in real terms and probably in nominal terms as well. Unlike in past episodes, the impact on construction from a drop in home prices should be limited, given that the US has not seen pervasive overbuilding. The drag on US consumption should also be somewhat muted. In contrast to what happened during the mid-2000s, outstanding balances on home equity lines of credit declined during the pandemic housing boom. US banks are on a strong footing today. This should limit the collateral damage from falling home prices on the financial system. Outside the US, the housing outlook is more challenging. This is especially the case in smaller developed economies such as Canada, Australia, New Zealand, and Sweden. It is also the case in China, where the property market may be on the verge of a Japanese-style multi-decade slide. Bottom Line: Softening housing markets around the world will weigh on growth. However, against the backdrop of high inflation, that may not be an unambiguously bad thing. We expect global equities to rise into year end, and then retreat in 2023. The Canary in the Coalmine On the eve of the Global Financial Crisis, Ed Leamer delivered a paper at Jackson Hole with the prescient title “Housing IS the Business Cycle.” Leamer convincingly argued that monetary policy primarily operates through the housing market, and that a decline in residential investment is by far the best warning sign of a recession. Table 1 provides supporting evidence for Leamer’s conclusion. It shows that residential investment is not a particularly important driver of GDP growth during non-recessionary quarters but is the only main expenditure component that regularly turns down in the lead-up to recessions. Table 1A Decline In Residential Investment Typically Precedes Recessions
The Risks From Housing
The Risks From Housing
US real residential investment was essentially flat in Q1 but then contracted at an annualized pace of 16% in Q2, shaving 0.83 percentage points off Q2 GDP growth in the process. The Atlanta Fed GDPNow model forecasts that real residential investment will shrink by 22% in Q3, largely reflecting the steep drop in housing starts and home sales observed over the past few months. Chart 1Housing Activity Should Start To Stabilize By The End Of The Year
Housing Activity Should Start To Stabilize By The End Of The Year
Housing Activity Should Start To Stabilize By The End Of The Year
The recent decline in construction activity is a worrying indicator. Nevertheless, there are several reasons to think that the downturn in housing may not herald an imminent recession. First, the lag between when housing begins to weaken and when the economy falls into recession can be quite long. For example, residential investment hit a high of 6.7% of GDP in Q4 of 2005. However, the Great Recession did not start until Q4 of 2007, when residential investment had already receded to 4.2% of GDP. The S&P 500 peaked during the same quarter. Second, recent weakness in housing activity largely reflects the lagged effects of the spike in mortgage rates earlier this year. To the extent that mortgage rates have been broadly flat since April, history suggests that housing activity should start to stabilize by the end of this year (Chart 1). Third, unlike in the mid-2000s, there is no glut of homes in the US today: Residential investment reached 4.8% of GDP last year, about where it was during the late 1990s, prior to the start of the housing bubble (Chart 2). The construction of new homes has failed to keep up with household formation for the past 15 years (Chart 3). As a result, the homeowner vacancy rate stands at 0.8%, the lowest on record (Chart 4). Chart 2Residential Investment Is Well Below Levels Seen During The Housing Bubble
Residential Investment Is Well Below Levels Seen During The Housing Bubble
Residential Investment Is Well Below Levels Seen During The Housing Bubble
Chart 3Home Construction Has Fallen Short Of Household Formation For The Past 15 Years
Home Construction Has Fallen Short Of Household Formation For The Past 15 Years
Home Construction Has Fallen Short Of Household Formation For The Past 15 Years
Chart 4The Homeowner Vacancy Rate Is At Record Lows
The Homeowner Vacancy Rate Is At Record Lows
The Homeowner Vacancy Rate Is At Record Lows
While new home inventories have risen, this mainly reflects an increase in the number of homes under construction. The inventory of finished homes is still 40% below pre-pandemic levels (Chart 5). The inventory of existing homes available for sale is also quite low, which suggests that a rising supply of new homes could be depleted more quickly than in the past. Chart 5While The Number Of Homes Under Construction Increased, The Inventory Of Newly Built And Existing Homes Remains Low
While The Number Of Homes Under Construction Increased, The Inventory Of Newly Built And Existing Homes Remains Low
While The Number Of Homes Under Construction Increased, The Inventory Of Newly Built And Existing Homes Remains Low
Why Was Housing Supply Slow to Rise? In real terms, the Case-Shiller index is now 5% above its 2006 peak (Chart 6). Why didn’t housing construction respond more strongly to rising home prices during the pandemic? Part of the answer is that the memory of the housing bust curtailed the homebuilders’ willingness to expand operations. Supply shortages also limited the ability of homebuilders to construct new homes in a timely fashion. Chart 7 shows that the producer price index for construction materials increased by nearly 50% between January 2020 and July 2022, outstripping the rise in the overall PPI index. Chart 6Real House Prices Are Above Their 2006 Peak
Real House Prices Are Above Their 2006 Peak
Real House Prices Are Above Their 2006 Peak
Chart 7Producer Prices For Construction Materials Shot Up During The Pandemic
Producer Prices For Construction Materials Shot Up During The Pandemic
Producer Prices For Construction Materials Shot Up During The Pandemic
Chart 8Constraints On Home Building Caused The Housing Market To Clear Mainly Through Higher Prices Rather Than Increased Construction
The Risks From Housing
The Risks From Housing
The lack of building materials and qualified construction workers caused the supply curve for housing to become increasingly steep (or, in the parlance of economics, inelastic). To make matters worse, pandemic-related lockdowns probably caused the supply curve to shift inwards, prompting homebuilders to curb output for any given level of home prices. As Chart 8 illustrates, this meant that the increase in housing demand during the pandemic was largely absorbed through higher home prices rather than through increased output. A Bittersweet Outcome Chart 9Unlike During The Great Recession, Prices For New And Existing Homes Should Fall In Tandem This Time Around
Unlike During The Great Recession, Prices For New And Existing Homes Should Fall In Tandem This Time Around
Unlike During The Great Recession, Prices For New And Existing Homes Should Fall In Tandem This Time Around
The discussion above presents a good news/bad news story about the state of the US housing market. On the one hand, with seasonally-adjusted housing starts now below where they were in January 2020, construction activity is unlikely to fall significantly from current levels. On the other hand, as the supply curve for housing shifts back out, and the demand curve shifts back in towards pre-pandemic levels, home prices are bound to weaken. We expect US home prices to decline, almost certainly in real terms and probably in nominal terms as well. Unlike during the Great Recession, when a wave of foreclosures caused the prices of existing homes to fall more than new homes, the decline in prices across both categories is likely to be similar this time around (Chart 9). The Impact of Falling Home Prices To what extent will lower home prices imperil the US economy? Beyond the adverse impact of lower prices on construction activity, falling home prices can depress aggregate demand through a negative wealth effect as well as by putting strain on the banking system. The good news is that both these channels are less operative today than they were prior to the GFC. Perhaps because home prices rose so rapidly over the past two years, homeowners did not get the chance to spend their windfall. The personal savings rate soared during the pandemic and has only recently fallen below its pre-pandemic average (Chart 10). Households are still sitting on about $2.2 trillion in excess savings, most of which is parked in highly liquid bank accounts. Outstanding balances on home equity lines of credit actually fell during the pandemic, sinking to a 21-year low of 1.3% of GDP in Q2 2022 (Chart 11). All this suggests that the coming decline in home prices will not suppress consumption as much as it did in the past. Chart 10Household Savings Surged During The Pandemic
Household Savings Surged During The Pandemic
Household Savings Surged During The Pandemic
Chart 11Despite Higher Home Prices, Households Are Not Using Their Homes As ATMs
Despite Higher Home Prices, Households Are Not Using Their Homes As ATMs
Despite Higher Home Prices, Households Are Not Using Their Homes As ATMs
The drop in home prices during the GFC generated a vicious circle where falling home prices led to more foreclosures and fire sales, leading to even lower home prices. Such a feedback loop is unlikely to emerge today. As judged by FICO scores, lenders have been quite prudent since the crisis (Chart 12). The aggregate loan-to-value ratio for US household real estate holdings stands near a low of 30%, down from 45% in the leadup to the GFC (Chart 13). Banks are also much better capitalized than they were in the past (Chart 14). Chart 12FICO Scores For Residential Mortgages Have Improved Considerably Since The Pre-GFC Housing Bubble
The Risks From Housing
The Risks From Housing
Chart 13This Is Not 2007
This Is Not 2007
This Is Not 2007
Chart 14US Banks Are Better Capitalized Than Before The GFC
US Banks Are Better Capitalized Than Before The GFC
US Banks Are Better Capitalized Than Before The GFC
The final thing to note is that home prices tend to fall fairly slowly. It took six years for prices to bottom following the housing bubble, and this was in the context of a severe recession. Thus, the negative wealth effect from falling home prices will probably not become pronounced until 2024 or later. A Grimmer Picture Abroad The housing outlook is more challenging in a number of economies outside of the US. While home prices have increased significantly in the US, they have risen much more in smaller developed economies such as Canada, Australia, New Zealand, and Sweden (Chart 15). My colleague, Jonathan LaBerge, has also argued that overbuilding appears to be more of a problem outside the US (Chart 16). Chart 15Rising Rates Will Weigh On Developed Economies With Pricey Housing Markets
Rising Rates Will Weigh On Developed Economies With Pricey Housing Markets
Rising Rates Will Weigh On Developed Economies With Pricey Housing Markets
Chart 16Canada And Several Other DM Countries Have Overbuilt Homes Since The Global Financial Crisis
Canada And Several Other DM Countries Have Overbuilt Homes Since The Global Financial Crisis
Canada And Several Other DM Countries Have Overbuilt Homes Since The Global Financial Crisis
Chart 17Slightly More Than Half Of Canadians Opted For Variable Rate Mortgages Over The Past 12 Months
Slightly More Than Half Of Canadians Opted For Variable Rate Mortgages Over The Past 12 Months
Slightly More Than Half Of Canadians Opted For Variable Rate Mortgages Over The Past 12 Months
The structure of some overseas mortgage markets heightens housing risks. In Canada, for example, more than half of homebuyers chose a variable-rate mortgage over the last 12 months (Chart 17). At present, about one-third of the total stock of mortgages are variable rate compared to less than 20% prior to the pandemic. Moreover, unlike in the US where 30-year mortgages are the norm, fixed-rate mortgages in Canada typically reset every five years. Thus, as the Bank of Canada hikes rates, mortgage payments will rise quite quickly. China: Following Japan’s Path? In the EM space, China stands out as having the most vulnerable housing market. The five major cities with the lowest rental yields in the world are all in China (Chart 18). Home sales, starts, and completions have all tumbled in recent months (Chart 19). The bonds of Chinese property developers are trading at highly distressed levels (Chart 20). Chart 18Chinese Real Estate Shows Vulnerabilities…
The Risks From Housing
The Risks From Housing
Chart 19...Activity And Prices Have Been Falling...
...Activity And Prices Have Been Falling...
...Activity And Prices Have Been Falling...
Chart 20...And the Bonds of Property Developers Are Trading At Distressed Levels
...And the Bonds of Property Developers Are Trading At Distressed Levels
...And the Bonds of Property Developers Are Trading At Distressed Levels
In many respects, the Chinese housing market resembles the Japanese market in the early 1990s. Just as was the case in Japan 30 years ago, Chinese household growth has turned negative (Chart 21). The collapse in the birth rate since the start of the pandemic will only exacerbate this problem. The number of births is poised to fall below 10 million this year, down more than 30% from 2019 (Chart 22). Chart 21China Faces A Structural Decline In The Demand For Housing
China Faces A Structural Decline In The Demand For Housing
China Faces A Structural Decline In The Demand For Housing
Chart 22China's Baby Bust
China's Baby Bust
China's Baby Bust
A few years ago, when inflation was subdued and talk of secular stagnation was all the rage, a downturn in the Chinese property sector would have been a major cause for concern. Things are different today. Global inflation is running high, and to the extent that investors are worried about a recession, it is because they think central banks will need to raise rates aggressively to curb inflation. A weaker Chinese property market would help restrain commodity prices, easing inflationary pressures in the process. As long as the Chinese banking system does not implode – which is highly unlikely given that the major banks are all state-owned – global investors might actually welcome a modest decline in Chinese property investment. Investment Conclusions The downturn in the US housing market suggests that we are in the late stages of the business-cycle expansion. However, given the long lags between when housing begins to weaken and when a recession ensues, it is probable that the US will only enter a recession in 2024. To the extent the stock market typically peaks six months before the outset of a recession, equities may still have further to run, at least in the near term. As we discussed last week, we recommend a neutral allocation on global stocks over a 12-month horizon but would overweight equities over a shorter-term 6-month horizon. In relative terms, the US housing market is more resilient than most other housing markets. We initiated a trade going long Canadian government bonds relative to US bonds on June 30, when the 10-year yield in Canada was 21 basis points above the comparable US yield. Today, the yield on both bonds is almost the same. We expect Canadian bonds to continue to outperform, given the more severe constraints the Bank of Canada faces in raising rates. Peter Berezin Chief Global Strategist peterb@bcaresearch.com Follow me on LinkedIn & Twitter Global Investment Strategy View Matrix
The Risks From Housing
The Risks From Housing
Special Trade Recommendations Current MacroQuant Model Scores
The Risks From Housing
The Risks From Housing