United States

Executive Summary Biden Taps China-Bashing Consensus
Biden's Midterm Tactics Bear Fruit… But There's A Snake
Biden's Midterm Tactics Bear Fruit… But There's A Snake
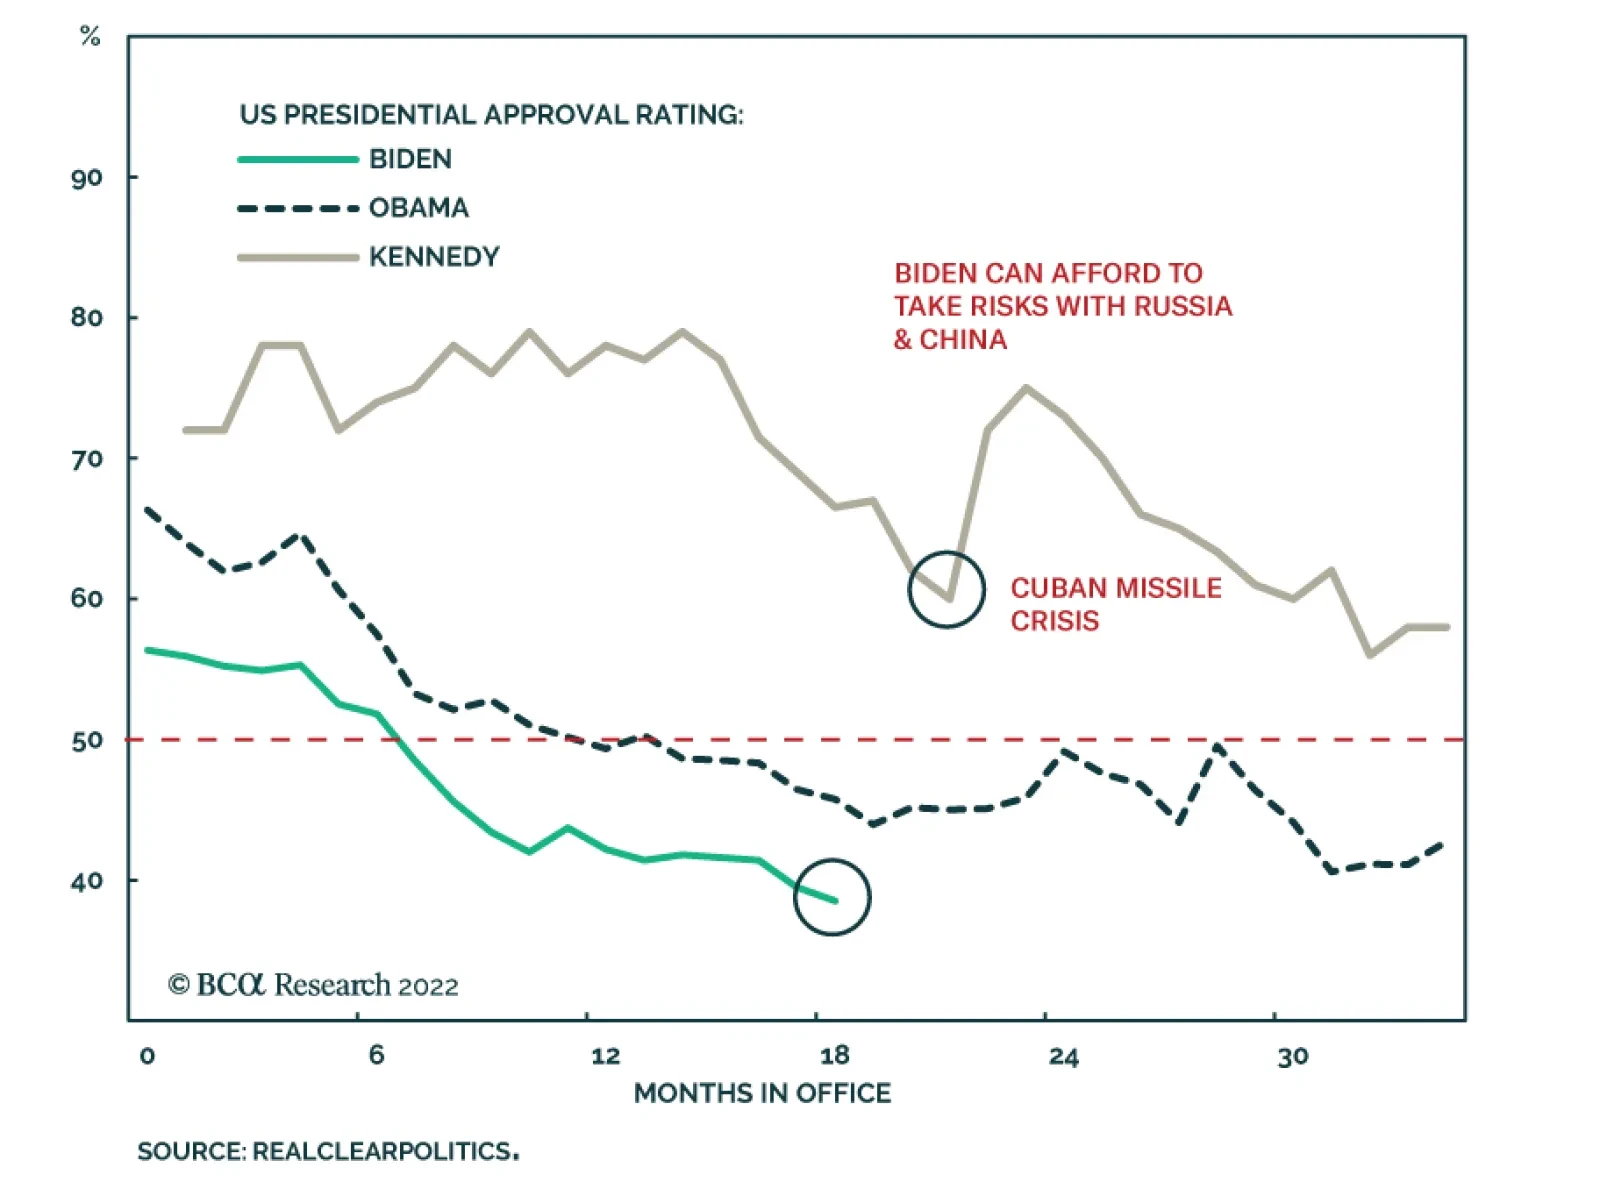
House Speaker Nancy Pelosi’s visit to Taiwan reflects one of our emerging views in 2022: the Biden administration’s willingness to take foreign policy risks ahead of the midterm elections. Biden’s foreign policy will continue to be reactive and focused on domestic politics through the midterms. Hence global policy uncertainty and geopolitical risk will remain elevated at least until November 8. Biden is seeing progress on his legislative agenda. Congress is passing a bill to compete with China while the Democrats are increasingly likely to pass a second reconciliation bill, both as predicted. These developments support our view that President Biden’s approval rating will stabilize and election races will tighten, keeping domestic US policy uncertainty elevated through November. These trends pose a risk to our view that Republicans will take the Senate, but the prevailing macroeconomic and geopolitical environment is still negative for the ruling Democratic Party. We expect legislative gridlock and frozen US fiscal policy in 2023-24. Close Recommendation (Tactical) Initiation Date Return Long Refinitiv Renewables Vs. S&P 500 Mar 30, 2022 25.4% Long Biotech Vs. Pharmaceuticals Jul 8, 2022 -3.3% Bottom Line: While US and global uncertainty remain high, we will stay long US dollar, long large caps over small caps, and long US Treasuries versus TIPS. But these are tactical trades and are watching closely to see if macroeconomic and geopolitical factors improve later this year. Feature President Biden’s average monthly job approval rating hit its lowest point, 38.5%, in July 2022. However, Biden’s anti-inflation campaign and midterm election tactics are starting to bear fruit: gasoline prices have fallen from a peak of $5 per gallon to $4.2 today, the Democratic Congress is securing some last-minute legislative wins, and women voters are mobilizing to preserve abortion access. These developments mean that the Democratic Party’s electoral prospects will improve marginally between now and the midterm election, causing Senate and congressional races to tighten – as we have expected. US policy uncertainty will increase. Investors will see a rising risk that Democrats will keep control of the Senate – and conceivably even the House – and hence retain unified control of the executive and legislative branches. This “Blue Sweep” risk will challenge the market consensus, which overwhelmingly (and still correctly) expects congressional gridlock in 2023-24. A continued blue sweep would mean larger tax hikes and social spending, while gridlock would neutralize fiscal policy for the next two years. Investors should fade this inflationary blue sweep risk and continue to plan for disinflationary gridlock. First, our quantitative election models still predict that Democrats will lose control of both House and Senate (Appendix). Second, Biden’s midterm tactics face very significant limitations, particularly emanating from geopolitics – the snake in this report’s title. Pelosi’s Trip To Taiwan Raises Near-Term Market Risks One of Biden’s election tactics is our third key view for 2022: reactive foreign policy. Initially we viewed this reactiveness as “risk-averse” but in May we began to argue that Biden could take risky bets given his collapsing approval ratings. Either way, Biden is using foreign policy as a means of improving his party’s domestic political fortunes. In particular, he is willing to take big risks with China, Russia, Iran, and terrorist groups like Al Qaeda. The template is the 1962 congressional election, when President John F. Kennedy largely defied the midterm election curse by taking a tough stance against Russia in the Cuban Missile Crisis (Chart 1). If Biden achieves a foreign policy victory, then Democrats will benefit. If he instigates a crisis, voters will rally around his administration out of patriotism. Nancy Pelosi’s visit to Taipei is the prominent example of this key view. The trip required full support from the US executive branch and military and was not only the swan song of a single politician. It was one element of the Biden administration’s decision to maintain the Trump administration’s hawkish China policy. Thus while Congress passes the $52 billion Chips and Science Act to enhance US competitiveness in technology and semiconductor manufacturing, Biden is also contemplating tightening export controls on computer chip equipment that China needs to upgrade its industry.1 Biden is reacting to a bipartisan and popular consensus holding that the US needs to take concrete measures to challenge China and protect American industry (Chart 2). This is different from the old norm of rhetorical China-bashing during midterms. Chart 1Biden Provokes Foreign Rivals
Biden's Midterm Tactics Bear Fruit… But There's A Snake
Biden's Midterm Tactics Bear Fruit… But There's A Snake
Chart 2Biden Taps China-Bashing Consensus
Biden's Midterm Tactics Bear Fruit… But There's A Snake
Biden's Midterm Tactics Bear Fruit… But There's A Snake
Reactive US foreign policy will continue through November and possibly beyond – including but not limited to China. The US chose to sell long-range weapons to Ukraine and provide intelligence targeting Russian forces, prompting Russia to declare that the US is now “directly” involved in the Ukraine conflict. The US decision to eradicate Al Qaeda leader Ayman Al-Zawahiri also reflects this foreign policy trend. Reactive foreign policy will increase the near-term risk of new negative geopolitical surprises for markets. Note that the 1962 Cuban Missile Crisis analogy is inverted when it comes to the Taiwan Strait. China is willing to take much greater risks than the US in its sphere of influence. The same goes for Russia in Ukraine. If US policy backfires then it may assist the Democrats in the election – but not if Biden suffers a humiliation or if the US economy suffers as a result. Chart 3US Import Prices Will Stay High From Greater China
US Import Prices Will Stay High From Greater China
US Import Prices Will Stay High From Greater China
US import prices will continue to rise from Greater China (Chart 3), undermining Biden’s anti-inflation agenda. Supply kinks in the semiconductor industry will become relevant again whenever demand rebounds (Chart 4). Global energy prices will also remain high as a result of the EU’s oil embargo and Russia’s continued tightening of European natural gas supplies. Chart 4New Semiconductor Kinks Will Appear When Demand Recovers
New Semiconductor Kinks Will Appear When Demand Recovers
New Semiconductor Kinks Will Appear When Demand Recovers
OPEC has decided only to increase oil production by 100,000 barrels per day, despite Biden’s visit to Saudi Arabia cap in hand. We argued that the Saudis would give a token but would largely focus on weakening global demand rather than pumping substantially more oil to help Biden and the Democrats in the election. The Saudis know that Biden is still attempting to negotiate a nuclear deal with Iran that would free up Iranian exports. So the Saudis are not giving much relief, and if Biden fails on Iran, oil supply disruptions will increase. Bottom Line: Price pressures will intensify as a result of the US-China and US-Russia standoffs – and probably also the US-Iran standoff. Hawkish foreign policy is not conducive to reducing inflationary ills. Global policy uncertainty and geopolitical risk will remain high throughout the midterm election season, causing continued volatility for US equities. Abortion Boosts Democratic Election Odds Earlier this year we highlighted that the Supreme Court’s overturning of the 1972 Roe v. Wade decision would lead to a significant mobilization of women voters in favor of the Democratic Party ahead of the midterm election. The first major electoral test since the court’s ruling, a popular referendum in the state of Kansas, produced a surprising result on August 2 that confirms and strengthens this thesis. Kansas is a deeply religious and conservative state where President Trump defeated President Biden by a 15% margin in 2020. The referendum was held during the primary election season, when electoral turnout skews heavily toward conservatives and the elderly. Yet Kansans voted by an 18% margin (59% versus 41%) not to amend the constitution, i.e. not to empower the legislature to tighten regulations on abortion. Voter turnout is not yet reported but likely far higher than in recent non-presidential primary elections. Kansans voted in the direction of nationwide opinion polling on whether abortion should be accessible in cases where the mother’s health is endangered. They did not vote in accordance with more expansive defenses of abortion, which are less popular (Chart 5). If the red state of Kansas votes this way then other states will see an even more substantial effect, at least when abortion is on the ballot. Chart 5Abortion Will Mitigate Democrats’ Losses
Biden's Midterm Tactics Bear Fruit… But There's A Snake
Biden's Midterm Tactics Bear Fruit… But There's A Snake
The question is how much of this Roe v. Wade effect will carry over to the general congressional elections. The referendum focused exclusively on abortion. Voters did not vote on party lines. Voters never like it when governments try to take away rights or privileges that have previously been granted. But in November the election will center on other topics, including inflation and the economy. And midterm elections almost always penalize the incumbent party. Our quantitative election models imply that Democrats will lose 22 seats in the House and two seats in the Senate, yielding Congress to the Republicans next year (Appendix). Still, women’s turnout presents a risk to our models. Women’s support for the Democratic Party has not improved markedly since the Supreme Court ruling, as we have shown in recent reports (Chart 6). But the polling could pick up again. Women’s turnout could be a significant tailwind in a year of headwinds for the Democrats. Bottom Line: Democrats’ electoral prospects have improved, as we anticipated earlier this year (Chart 7). This trend will continue as a result of the mobilization of women. Republicans are still highly likely to take Congress but our conviction on the Senate is much lower than it is on the House. Chart 6Biden’s And Democrats’ Approval Among Women
Biden's Midterm Tactics Bear Fruit… But There's A Snake
Biden's Midterm Tactics Bear Fruit… But There's A Snake
Chart 7Democrats’ Odds Will Improve On Margin
Biden's Midterm Tactics Bear Fruit… But There's A Snake
Biden's Midterm Tactics Bear Fruit… But There's A Snake
Reconciliation Bill: Still 65% Chance Of Passing Ultimately Democrats’ electoral performance will depend on inflation, the economy, and cyclical dynamics. If inflation falls over the course of the next three months, then Democrats will have a much better chance of stemming midterm losses. That is why President Biden rebranded his slimmed down “Build Back Better” reconciliation bill as the “Inflation Reduction Act.” We maintain our 65% odds that the bill will pass, as we have done all year. There is still at least a 35% chance that Senator Kyrsten Sinema of Arizona could defect from the Democrats, given that she opposed any new tax hikes and the reconciliation bill will impose a 15% minimum tax on corporations. A single absence or defection would topple the budget reconciliation process, which enables Democrats to pass the bill on a simple majority vote. We have always argued that Sinema would ultimately fall in line rather than betraying her party at the last minute before the election. This is even more likely given that moderate-in-chief, Senator Joe Manchin of West Virginia, negotiated and now champions the bill. But some other surprise could still erase the Democrats’ single-seat majority, so we stick with 65% odds. Most notably the bill will succeed because it actually reduces the budget deficit – by an estimated $300 billion over a decade (Table 1). Deficit reduction was the original purpose of lowering the number of votes required to pass a bill under the budget reconciliation process. Now Democrats are using savings generated from new government caps on pharmaceuticals (a popular measure) to fund health and climate subsidies. Given deficit reduction, it is conceivable that a moderate Republican could even vote for the bill. Table 1Democrats’ Inflation Reduction Act (Budget Reconciliation)
Biden's Midterm Tactics Bear Fruit… But There's A Snake
Biden's Midterm Tactics Bear Fruit… But There's A Snake
Bottom Line: Democrats are more likely than ever to pass their fiscal 2022 reconciliation bill by the September 30 deadline. The bill will cap some drug prices and reduce the deficit marginally, so it can be packaged as an anti-inflation bill, giving Democrats a legislative win ahead of the midterm. However, its anti-inflationary impact will ultimately be negligible as $300 billion in savings hardly effects the long-term rising trajectory of US budget deficits relative to output. The bill will add to voters’ discretionary income and spur the renewable energy industry. And if it helps the Democrats retain power, then it enables further spending and tax hikes down the road, which would prove inflationary. The reconciliation bill, annual appropriations, and the China competition bill were the remaining bills that we argued would narrowly pass before the US Congress became gridlocked again. So far this view is on track. Investment Takeaways Companies that paid a high effective corporate tax rate before President Trump’s tax cuts have benefited relative to those that paid a low effective rate. They stood to suffer most if Trump’s tax cuts were repealed. But Democrats were forced to discard their attempt to raise the overall corporate tax rate last year. Instead the minimum corporate rate will rise to 15%, hitting those that paid the lowest effective rate, such as Big Tech companies, relative to high-tax rate sectors such as energy (Chart 8, top panel). Tactically energy may still underperform tech but cyclically energy could outperform and the reconciliation bill would feed into that trend. Similarly, companies that faced high foreign tax risk, because they made good income abroad but paid low foreign tax rates, stand to suffer most from the imposition of a minimum corporate tax rate (Chart 8, bottom panel). Again, Big Tech stands to suffer, although it has already priced a lot of bad news and may not perform poorly in the near term. Chart 8Market Responds To Minimum Corporate Tax
Market Responds To Minimum Corporate Tax
Market Responds To Minimum Corporate Tax
Chart 9Market Responds To New Climate Subsidies
Market Responds To New Climate Subsidies
Market Responds To New Climate Subsidies
Renewable energy stocks have rallied sharply on the news of the Democrats’ reconciliation bill getting back on track (Chart 9). We are booking a 25.4% gain on this tactical trade and will move to the sidelines for now, although renewable energy remains a secular investment theme. Health stocks, particularly pharmaceuticals, have taken a hit from the new legislation as we expected. However, biotech has not outperformed pharmaceuticals as we expected, so we will close this tactical trade for a loss of 3.3%. The reconciliation bill will cap drug prices for only the most popular generic drugs and does not pose as much of a threat to biotech companies (Chart 10). Biotech should perform well tactically as long bond yields decline – they are also historically undervalued, as noted by Dhaval Joshi of our Counterpoint strategy service. So we will stick to long Biotech versus the broad market. US semiconductors remain in a long bull market and will be in heavy demand once global and US economic activity stabilize. They are also likely to outperform competitors in Greater China that face a high and persistent geopolitical risk premium (Chart 11). Chart 10Market Responds To Drug Price Caps
Market Responds To Drug Price Caps
Market Responds To Drug Price Caps
Chart 11Market Responds To China Competition Bill
Market Responds To China Competition Bill
Market Responds To China Competition Bill
Tactically we prefer bonds to stocks, US equities to global equities, defensive sectors to cyclicals, large caps to small caps, and growth stocks to value stocks (Chart 12). The US is entering a technical recession, Europe is entering recession, China’s economy is weak, and geopolitical tensions are at extreme highs over Ukraine, Taiwan, and Iran. The US is facing an increasingly uncertain midterm election. These trends prevent us from adding risk in our portfolio in the short term. However, much bad news is priced and we are on the lookout for positive economic surprises and successful diplomatic initiatives to change the investment outlook for 2023. If the US and China recommit to the status quo in the Taiwan Strait, if Russia moves toward ceasefire talks in Ukraine, if the US and Iran rejoin the 2015 nuclear deal, then we will take a much more optimistic attitude. Some political and geopolitical risks could begin to recede in the fourth quarter – although that remains to be seen. And even then, geopolitical risk is rising on a secular basis. Chart 12Tactically Recession And Geopolitics Will Weigh On Risk Assets
Tactically Recession And Geopolitics Will Weigh On Risk Assets
Tactically Recession And Geopolitics Will Weigh On Risk Assets
Matt Gertken Senior Vice President Chief US Political Strategist mattg@bcaresearch.com Footnotes 1 Alexandra Alper and Karen Freifeld, “U.S. considers crackdown on memory chip makers in China,” Reuters, August 1, 2022, reuters.com. Strategic View Open Tactical Positions (0-6 Months) Open Cyclical Recommendations (6-18 Months) Table A2Political Risk Matrix
Biden's Midterm Tactics Bear Fruit… But There's A Snake
Biden's Midterm Tactics Bear Fruit… But There's A Snake
Table A3US Political Capital Index
Biden's Midterm Tactics Bear Fruit… But There's A Snake
Biden's Midterm Tactics Bear Fruit… But There's A Snake
Chart A1Presidential Election Model
Third Quarter US Political Outlook: Last Ditch Effort
Third Quarter US Political Outlook: Last Ditch Effort
Chart A2Senate Election Model
Third Quarter US Political Outlook: Last Ditch Effort
Third Quarter US Political Outlook: Last Ditch Effort
Table A4House Election Model
Biden's Midterm Tactics Bear Fruit… But There's A Snake
Biden's Midterm Tactics Bear Fruit… But There's A Snake
Table A5APolitical Capital: White House And Congress
Biden's Midterm Tactics Bear Fruit… But There's A Snake
Biden's Midterm Tactics Bear Fruit… But There's A Snake
Table A5BPolitical Capital: Household And Business Sentiment
Biden's Midterm Tactics Bear Fruit… But There's A Snake
Biden's Midterm Tactics Bear Fruit… But There's A Snake
Table A5CPolitical Capital: The Economy And Markets
Biden's Midterm Tactics Bear Fruit… But There's A Snake
Biden's Midterm Tactics Bear Fruit… But There's A Snake
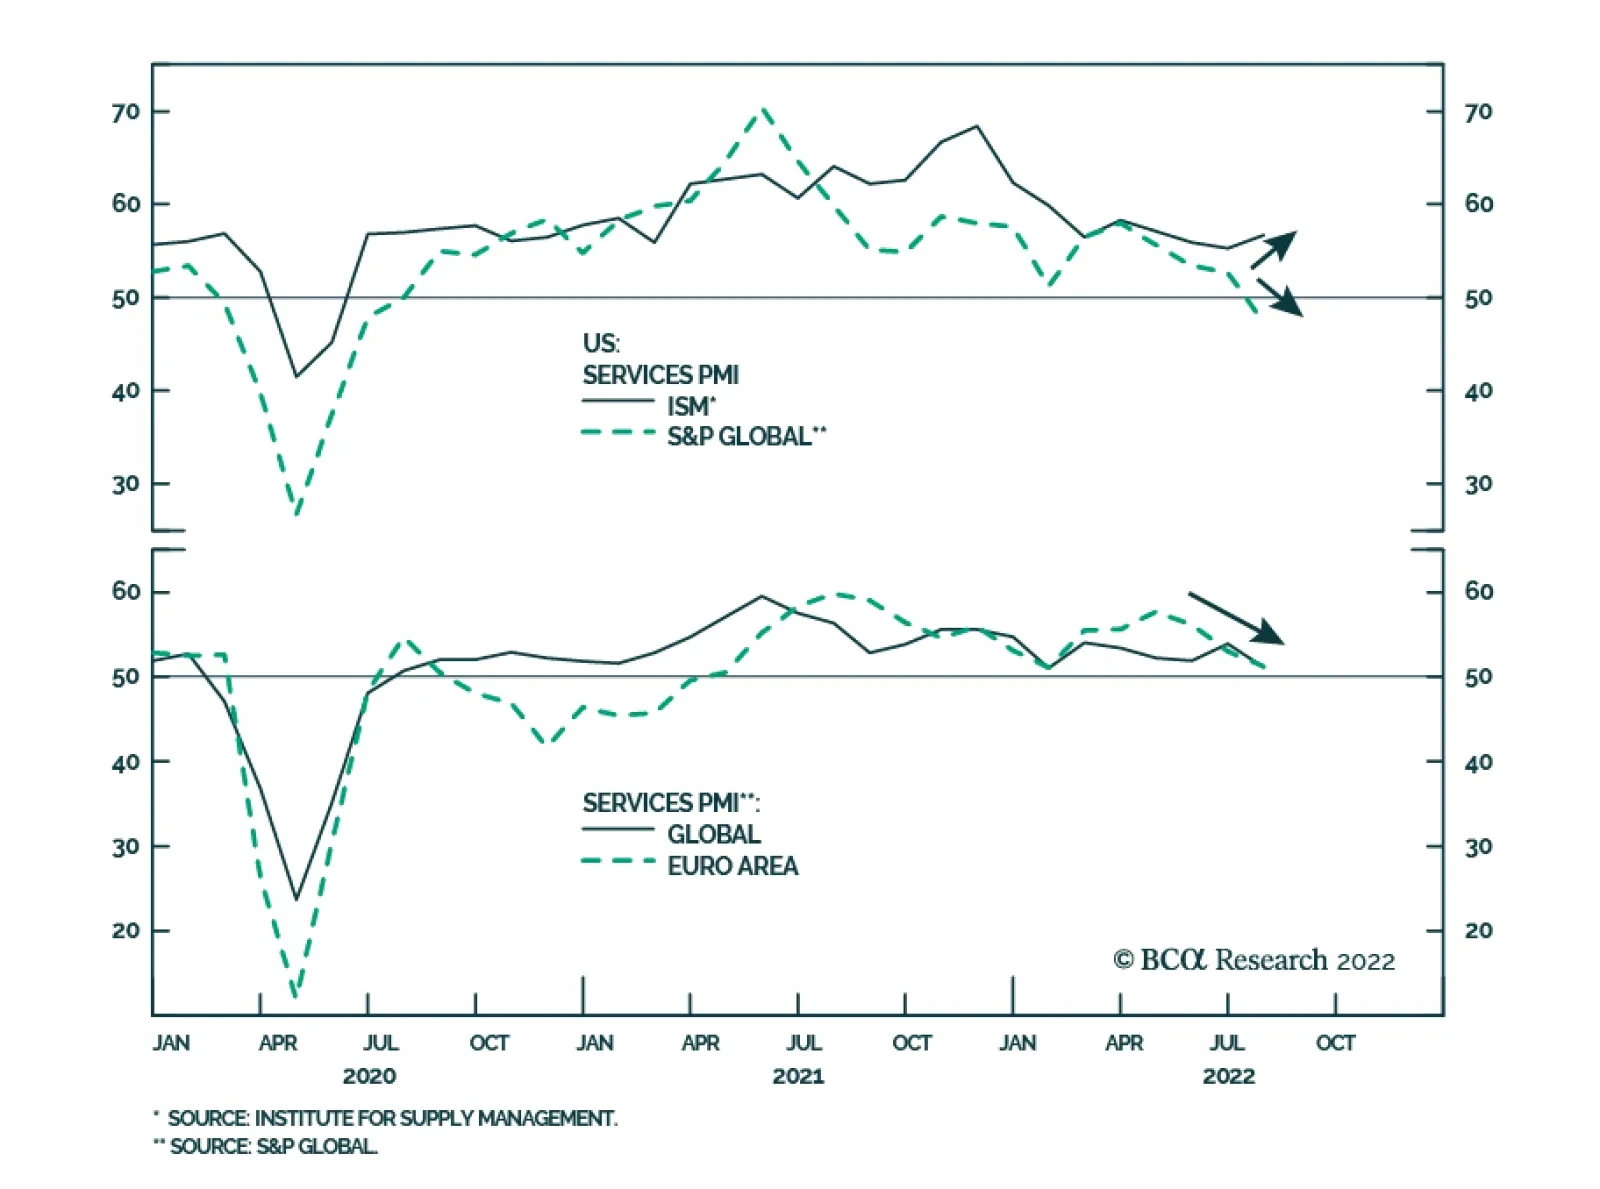
The final prints of July’s Eurozone and US Services and Composite PMIs were revised up from their preliminary estimates. Notably, the July Eurozone Composite gauge suggests that economic activity stagnated in June (final PMI estimate of 49.9 against a…
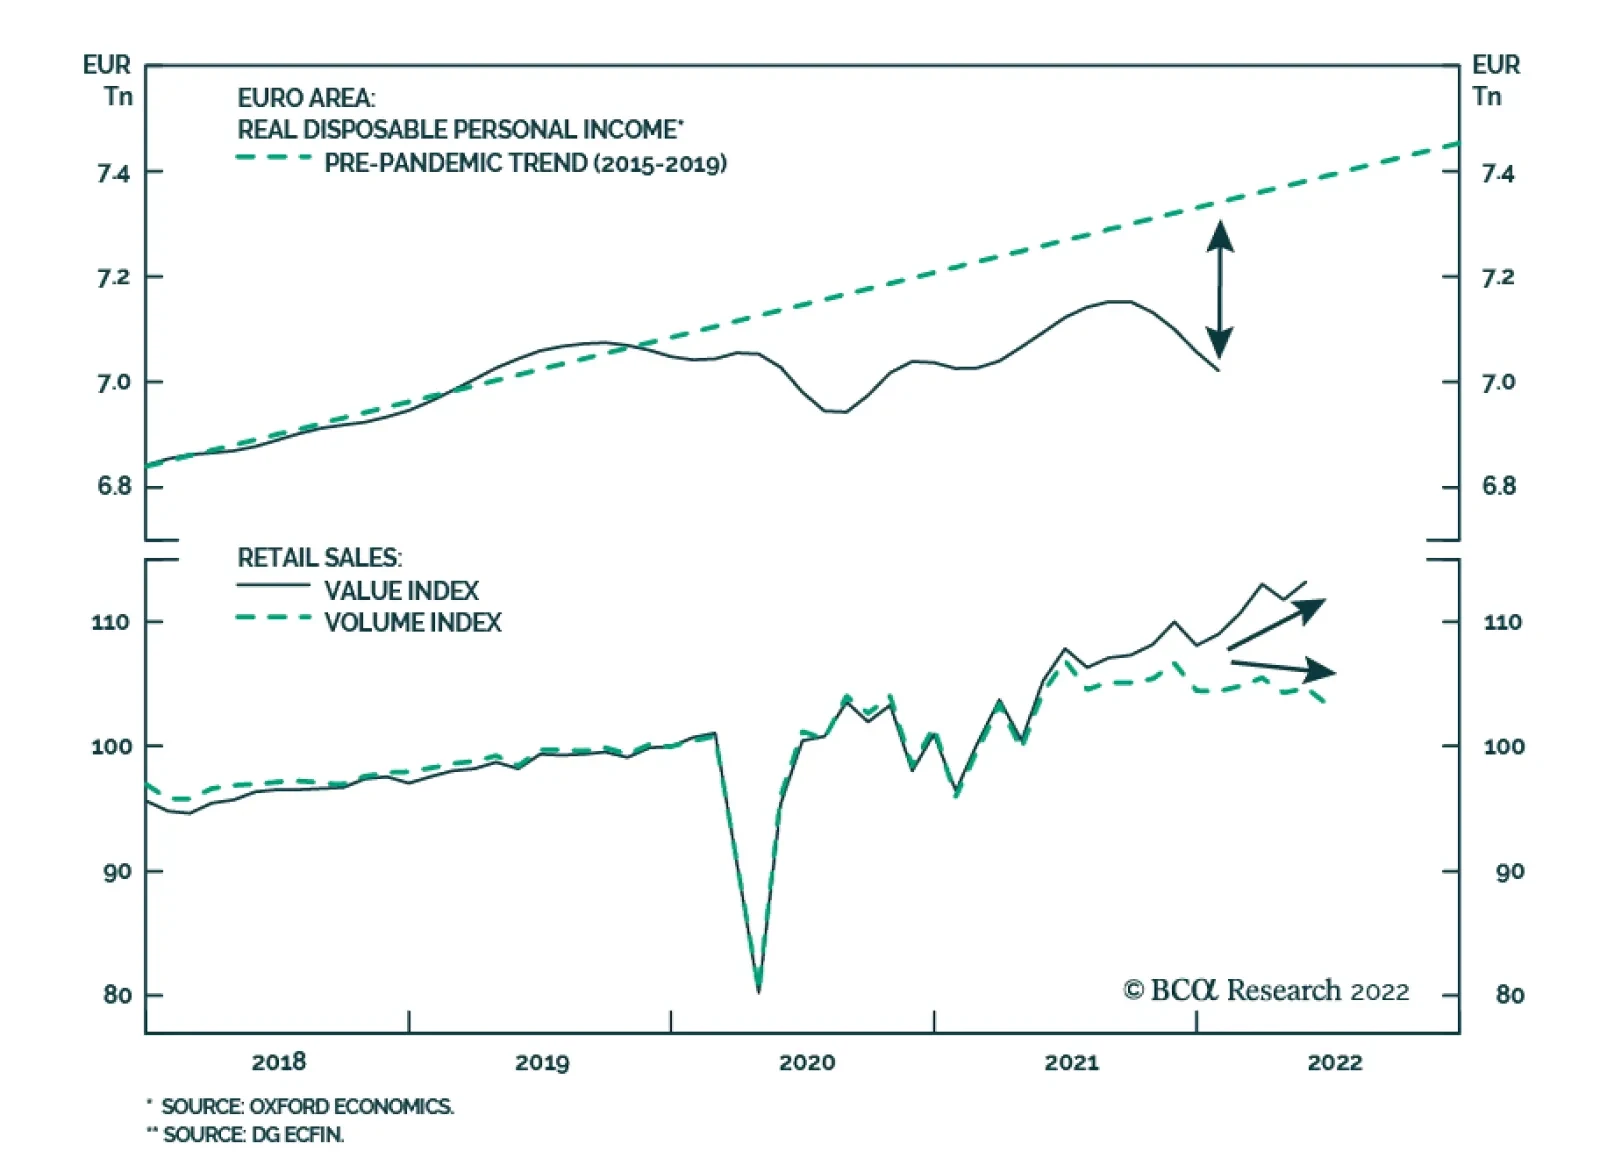
Eurozone retail sales disappointed in June. The 3.7% y/y contraction in sales volumes marks the first annual decline since February 2021 and is significantly worse than expectations of a 1.7% decrease. Similarly, the 1.2% m/m drop disappointed expectations…
Following the recent sharp post-FOMC rally, BCA Research’s Global Investment Strategy service has shifted their 12-month equity recommendation from overweight to neutral. They expect stock prices to rise further during the remainder of the year as US…
Executive Summary Government bond yields worldwide are falling due to fears of a global recession that will lead to monetary easing in 2023. This pricing is too optimistic with inflation likely to remain well above central bank targets next year. Even though US real GDP contracted modestly in the first half of 2022, the broader flow of US economic data is more consistent with an economy that is slowing substantially but not yet in recession. The Fed welcomes sharply slower growth to deal with high inflation, but will not unwind the 2022 rate hikes as quickly as markets expect given sticky core/wage inflation. The Fed rate cuts now discounted for 2023 will likely not be delivered. No Major Recessionary Signal From Global Yield Curves … Yet
No Major Recessionary Signal From Global Yield Curves . . . Yet
No Major Recessionary Signal From Global Yield Curves . . . Yet
Bottom Line: Falling global bond yields have helped stabilize risk assets – a path that will eventually lead to a rebound in yields if easier financial conditions help avoid a deep recession. Stay neutral overall duration exposure in global bond portfolios. The Great Recession Debate Begins Global bond yields have seen substantial declines over the past few weeks, as the market narrative has quickly changed from surging inflation and rate hikes to imminent recession and eventual rate cuts (Chart 1). The truth is somewhere in the middle, with global inflation in the process of peaking and global growth slowing rapidly but not yet in full-blown recession. Related Report Global Fixed Income StrategyMixed Messages & Range-Bound Bond Yields Bond markets are expecting central banks, most importantly the Fed, to quickly abandon the fight against high inflation for a new battle to tackle decelerating economic growth. The problem for investors is that weaker growth is needed – and, indeed, welcomed by policymakers - to create economic slack to help bring down elevated inflation. There is little evidence of such a disinflationary slack being created, with unemployment rates still near cyclical lows in the US, Europe and most of the developed world. The link between longer-term bond yields and shorter-term interest rate expectations remains strong in an environment of very flat government yield curves. For example, in the US, the 10-year Treasury yield has fallen from a peak of 3.47% in mid-June to 2.67% at the end of July. Over the same period, the 1-month interest rate, two-years ahead priced into the US overnight index swap (OIS) curve fell from a peak of 3.1% to 2.1% (Chart 2). Chart 1A Downward Adjustment Of Interest Rate Expectations
A Downward Adjustment Of Interest Rate Expectations
A Downward Adjustment Of Interest Rate Expectations
Chart 2A Lower Trajectory For Rates Priced In As Growth Slows
A Lower Trajectory For Rates Priced In As Growth Slows
A Lower Trajectory For Rates Priced In As Growth Slows
An even more dramatic decline in yields has been seen in Europe. The 10-year German Bund yield has fallen from a mid-June peak of 1.75% to 0.83% at the end of July, while the 1-month/2-year forward European OIS rate fell from 2.5% to 1.1%. The 2-year German yield, most sensitive to ECB rate hike expectations, also fell dramatically from 1.15% to 0.24%. There have also been substantial declines in bond yields and rate expectations in the UK, Canada and Australia over the past six weeks. As central banks continue to raise policy rates towards levels perceived to be at least neutral, if not mildly restrictive, there should a stronger correlation between future rate hike expectations and longer-term bond yields. Put another way, yield curves tend to flatten and eventually invert as policymakers move rates to levels that should slow growth and, eventually, reduce inflation. Currently, the “global” 2-year/10-year government bond yield curve, using Bloomberg Global Treasury index data, is slightly inverted at -13bps (Chart 3). More deeper curve inversions typically precede major contractions in global growth and equity prices. Chart 3No Major Recessionary Signal From Global Yield Curves . . . Yet
No Major Recessionary Signal From Global Yield Curves . . . Yet
No Major Recessionary Signal From Global Yield Curves . . . Yet
At the moment, global equities have performed in line with deeper curve inversions and contracting growth, with the MSCI World equity index down -7% on a year-over-year basis (bottom panel). Yet actual global growth is not yet in contraction. Global industrial production, while slowing, is still growing at a +3% year-over-year rate. The global manufacturing PMI remains above 50, indicative of a still-expanding manufacturing sector. Euro area, which is widely believed to already be in recession, saw real GDP growth (non-annualized) of +0.5% and +0.7%, respectively, in Q1 and Q2 of this year. Meanwhile, US real GDP shrank modestly over the first half of 2022, down only -0.6% (non-annualized) over Q1 and Q2, but with no corroborating evidence of recession from the labor market with the headline unemployment rate falling from 4.0% to 3.6% over that same period. Further adding to the confusing mix of signals between yield curves and growth is that the curve inversion at the global level is not yet evident across all countries. For example, the 2-year/10-year curve is inverted in the US and Canada, countries where central banks have been more aggressive on hiking rates in 2022 (Chart 4A) Yet in both countries, there have only been moderate declines in leading economic indicators and composite PMIs (combining manufacturing and services). In contrast, the 2-year/10-year curve in Germany and the UK – where the ECB and Bank of England have delivered fewer rates than the Fed and Bank of Canada – remains positively sloped but with similar moderate declines in leading economic indicators and composite PMIs to those seen in the US and Canada (Chart 4B). Chart 4AA Policy-Driven Slowdown In North America
A Policy-Driven Slowdown In North America
A Policy-Driven Slowdown In North America
Chart 4BAn Energy-Driven Slowdown In Europe
An Energy-Driven Slowdown In Europe
An Energy-Driven Slowdown In Europe
Chart 5Central Banks Cannot Pivot Dovishly Against This Backdrop
Central Banks Cannot Pivot Dovishly Against This Backdrop
Central Banks Cannot Pivot Dovishly Against This Backdrop
The deceleration of growth seen so far in this countries is nowhere near enough for central banks to begin contemplating a pivot away from hawkish rate hikes in 2022 to dovish rate cuts in 2023/24, as markets are now discounting. Inflation rates remain far too elevated, and labor markets remain far too tight, for policymakers to switch from the brake pedal to the gas pedal (Chart 5). This exposes global bond yields to a rebound from recent lows as central banks disappoint the market’s growing belief that policymakers’ focus will turn to growth from inflation. The language from recent central bank policy decisions, from the ECB’s 50bp hike on July 21 to the Fed’s 75bp hike last week to yesterday’s 50bp hike by the Reserve Bank of Australia, has been consistent, calling for a continued need to tighten policy. All three central banks essentially abandoned forward guidance, but described future rate moves as being “data dependent”, particularly inflation data. There is likely to be some relief from elevated inflation rates over the next few months. There have already been substantial declines in the growth of commodity prices, with the CRB Raw Industrials index now contracting in year-over-year terms (Chart 6). Global shipping costs and supplier delivery times have also declined, as evidence of some easing of supply chain disruptions that is helping bring down goods inflation. Yet given the starting point of such high headline inflation rates – at or above 9% in the US, UK and euro area – it is unlikely that there will be enough disinflation from the commodity/goods space to quickly bring inflation down by enough for central banks to breathe easier. This is especially true given that stickier domestically generated inflation stemming from wages and services will remain well above central bank targets over at least the next year, or at least until there is a substantial increase in slack-producing unemployment (i.e. a recession). What does all this mean for our view on the direction of global bond yields? We still see the current environment as more consistent with broad trading ranges for yields, rather than the start of a new major downtrend or uptrend. Europe was the one exception to this view, given how markets were pricing in a rise in ECB policy rates that was too aggressive, but even that has now corrected after the dramatic collapse in core European yields from the mid-June peak. Our Global Duration Indicator has been calling for a loss of cyclical upward momentum of bond yields in the latter half of 2022, which is now starting to play out (Chart 7). That indicator is focused on growth indicators like our global leading economic indicator and the ZEW expectations index for the US and Europe, all of which have been declining for the past several months. Chart 6Global Inflation Is Peaking
Global Inflation Is Peaking
Global Inflation Is Peaking
Chart 7Stay Neutral On Global Duration Exposure
Stay Neutral On Global Duration Exposure
Stay Neutral On Global Duration Exposure
However, there is a potential note of economic optimism from another key component of the Global Duration Indicator - the diffusion index of our global leading economic indicator, which measures the number of countries with rising leading indicators versus those with falling ones. That diffusion index has hooked up as the leading economic indicators of some important countries that are typically leveraged to global growth – China, Japan, Brazil, Korea and Malaysia – have started to move higher. If this trend continues in the months ahead, our Duration Indicator may signal a reacceleration of global bond yield momentum in the first half of 2023 as the global growth outlook improves. Bottom Line: Bond markets are overreacting to slowing global growth momentum by pricing in a quick reversal of 2022 rate hikes in 2023 across the developed world. Do not chase bond yields lower. The Fed Will Respond To Inflation Before Recession The Q2/2022 US GDP report showed an annualized decline of -0.9%, following on the annualized -1.6% fall in Q1 real GDP (Chart 8). This fulfills the so-called “technical definition” of a recession widely cited by the financial media. However, the official arbiters of recession dating – the National Bureau of Economic Research, or NBER – use a broader list of data to identify recessions that focus on income growth, employment and industrial production. None of those indicators contracted in the first half of the year, when the GDP-defined recession allegedly took place. We are sympathetic to the view that the US has not yet entered recession. However, recession odds are increasing, with many reliable cyclical data series slowing to a pace that has preceded past recessions. In Chart 9, we show a “cycle-on-cycle” comparison of the latest readings on some highly cyclical US economic data with readings from past recessions dating back to the late 1970s. In the chart, the data series are lined up such that the vertical line represents the NBER-designated start date of each recession, starting with the 1979/80 recession up to the 2008 recession. We show both the average path for each series across all of those recessions (the dotted line) and the range of outcomes from each recession (the shaded zone). Given the unique nature of the 2020 COVID recession, which was limited to just one quarter of collapsing activity due to pandemic lockdowns rather than typical business cycle forces, we did not include that episode in this chart. Chart 8No US Growth In H1/2022
No US Growth In H1/2022
No US Growth In H1/2022
The selected variables in this cycle-on-cycle analysis are: The year-over-year growth of the Conference Board leading economic indicator The ISM manufacturing index The University Of Michigan consumer expectations index The year-over-year growth of housing starts The year-over-year growth rate of non-financial (top-down) corporate profits. Chart 9The US Is Definitely Flirting With Recession
The US Is Definitely Flirting With Recession
The US Is Definitely Flirting With Recession
All five series selected have slowed over past several months, consistent with the run-up to previous recessions. However, in terms of timing, not all of the indicators shown are at levels that would be consistent with the US already being in a recession, as the real GDP contractions in Q1 and Q2 would suggest. Typically, the ISM index falls below 50 at the start of the recession, while the growth in the leading indicator turns negative about six months before the start of the recession. The current readings on both are still modestly above levels seen at the start of those past recessions. Corporate profit growth typically contracts for a full year ahead of recessions, and the latest complete reading available from Q1 was still showing positive, albeit slowing, growth. Chart 10The Fed Is OK With This Outcome, Given High Inflation
The Fed Is OK With This Outcome, Given High Inflation
The Fed Is OK With This Outcome, Given High Inflation
Some of the indicators shown are looking recessionary. The current contraction in the growth of housing starts is in line with the timing from the average of past recessions. The same can be said for falling consumer expectations, although the latest decline is particularly severe compared to past recessions. From the point of view of investors, the semantics over the “official” declaration of a recession are irrelevant. There has already been a major pullback in US equity markets and widening of US corporate credit spreads as investors have priced in substantially slower growth – and the Fed tightening that is helping engineer that economic outcome. The pullback in risk assets has tightened US financial conditions, exacerbating the hit to business and consumer confidence from high inflation and declining real incomes (Chart 10). Equity and credit markets did stage healthy recoveries in the month of June as markets began to price out Fed rate hikes in response to the US potentially entering recession. However, Fed rate hikes have already flattened the US Treasury curve, which has raised the odds of a US recession NEXT year. According to the New York Fed’s recession probability model, the current spread between the 10-year US Treasury yield and the 3-month US Treasury bill rate of 23bps translates to a 26% probability of a US recession occurring one year from now (Chart 11). That model uses data going back to the 1960s, which includes the Volcker-era Fed tightenings in the 1970s that resulted in dramatic increases in real US interest rates and steep inversions of the US Treasury curve. Using the post-1980 range of recession probabilities, ranging from 0-50%, the latest 26% probability is more like a 50/50 bet on a 2023 US recession. Chart 11A US Recession Is More Likely In 2023, Says The UST Curve
A US Recession Is More Likely In 2023, Says The UST Curve
A US Recession Is More Likely In 2023, Says The UST Curve
The Fed will need to continue delivering rate hikes until there is evidence that core inflation has peaked and will begin the path of falling back to the Fed’s 2% target. That is certainly not a story for 2022, or even for 2023, given the rapid acceleration of US wage growth (Chart 12). If the Fed were to begin pivoting away from rate hikes now, with the Atlanta Fed Wage Tracker and the Employment Cost Index accelerating at a 5-7% pace, the result would be an unwanted increase in inflation expectations. Chart 12The Fed Must Stay Hawkish With Labor Costs Still Accelerating
The Fed Must Stay Hawkish With Labor Costs Still Accelerating
The Fed Must Stay Hawkish With Labor Costs Still Accelerating
The Fed is fighting hard to regain the inflation-fighting credibility lost in 2022 when “Team Transitory” ruled the FOMC and policy did not respond to rapidly rising inflation. The Fed’s aggressive rate hikes in 2022 have helped restore some of that credibility with bond markets, judging by the pullback in longer-term CPI-based TIPS breakevens seen in recent months, which are now back in line with the 2.3-2.5% range we have deemed consistent with the Fed’s 2% PCE inflation target (Chart 13). The evidence from survey-based measures of inflation expectations is a bit mixed, but still consistent with improved Fed credibility. The New York Fed’s Consumer Survey shows 1-year-ahead inflation expectations still elevated at 6.8%, but the 3-year-ahead expectation has drifted back below 4% (bottom panel). The University of Michigan 5-10 year consumer inflation expectation is even lower, falling to 2.8% in July from 3.1% in June. The Fed will not risk those hard-earned declines in longer-term inflation expectations by turning dovish too quickly – especially as it is not year clear if the US is even in a recession. Investors betting on a dovish pivot by the Fed before year end, leading to substantial rate cuts in 2023, are likely to be disappointed. In our view, this is setting up a potential opportunity to reduce US duration exposure to position for a rebound in Treasury yields. However, a meaningful increase in yields will be difficult to achieve, as yields are still adjusting to downside data surprises and duration positioning among investors is still below benchmark, according to the JPMorgan client duration survey (Chart 14). We suggest staying neutral on US duration exposure, for now, until the technical backdrop becomes more conducive to higher yields. Chart 13Mixed Messages On US Inflation Expectations
Mixed Messages On US Inflation Expectations
Mixed Messages On US Inflation Expectations
Chart 14Stay Neutral On US Duration - For Now
Stay Neutral On US Duration - For Now
Stay Neutral On US Duration - For Now
Bottom Line: US recession odds have increased, but the economy is not yet in recession. The Fed welcomes sharply slower growth to deal with high inflation, but will not unwind the 2022 rate hikes as quickly as markets expect given sticky core/wage inflation. The Fed rate cuts now discounted for 2023 will likely not be delivered. Treasury yields are more likely to stay rangebound over the next 3-6 months than move lower. Robert Robis, CFA Chief Fixed Income Strategist rrobis@bcaresearch.com GFIS Model Bond Portfolio Recommended Positioning Active Duration Contribution: GFIS Recommended Portfolio Vs. Custom Performance Benchmark
Dovish Central Bank Pivots Will Come Later Than You Think
Dovish Central Bank Pivots Will Come Later Than You Think
The GFIS Recommended Portfolio Vs. The Custom Benchmark Index Global Fixed Income - Strategic Recommendations*
Dovish Central Bank Pivots Will Come Later Than You Think
Dovish Central Bank Pivots Will Come Later Than You Think
The US JOLTS report showed the number of job openings decreased to a lower-than-expected 10.7 million in June, from 11.3 million in May, marking a third consecutive month of decline and the smallest increase since September 2021. Retail trade accounted for…
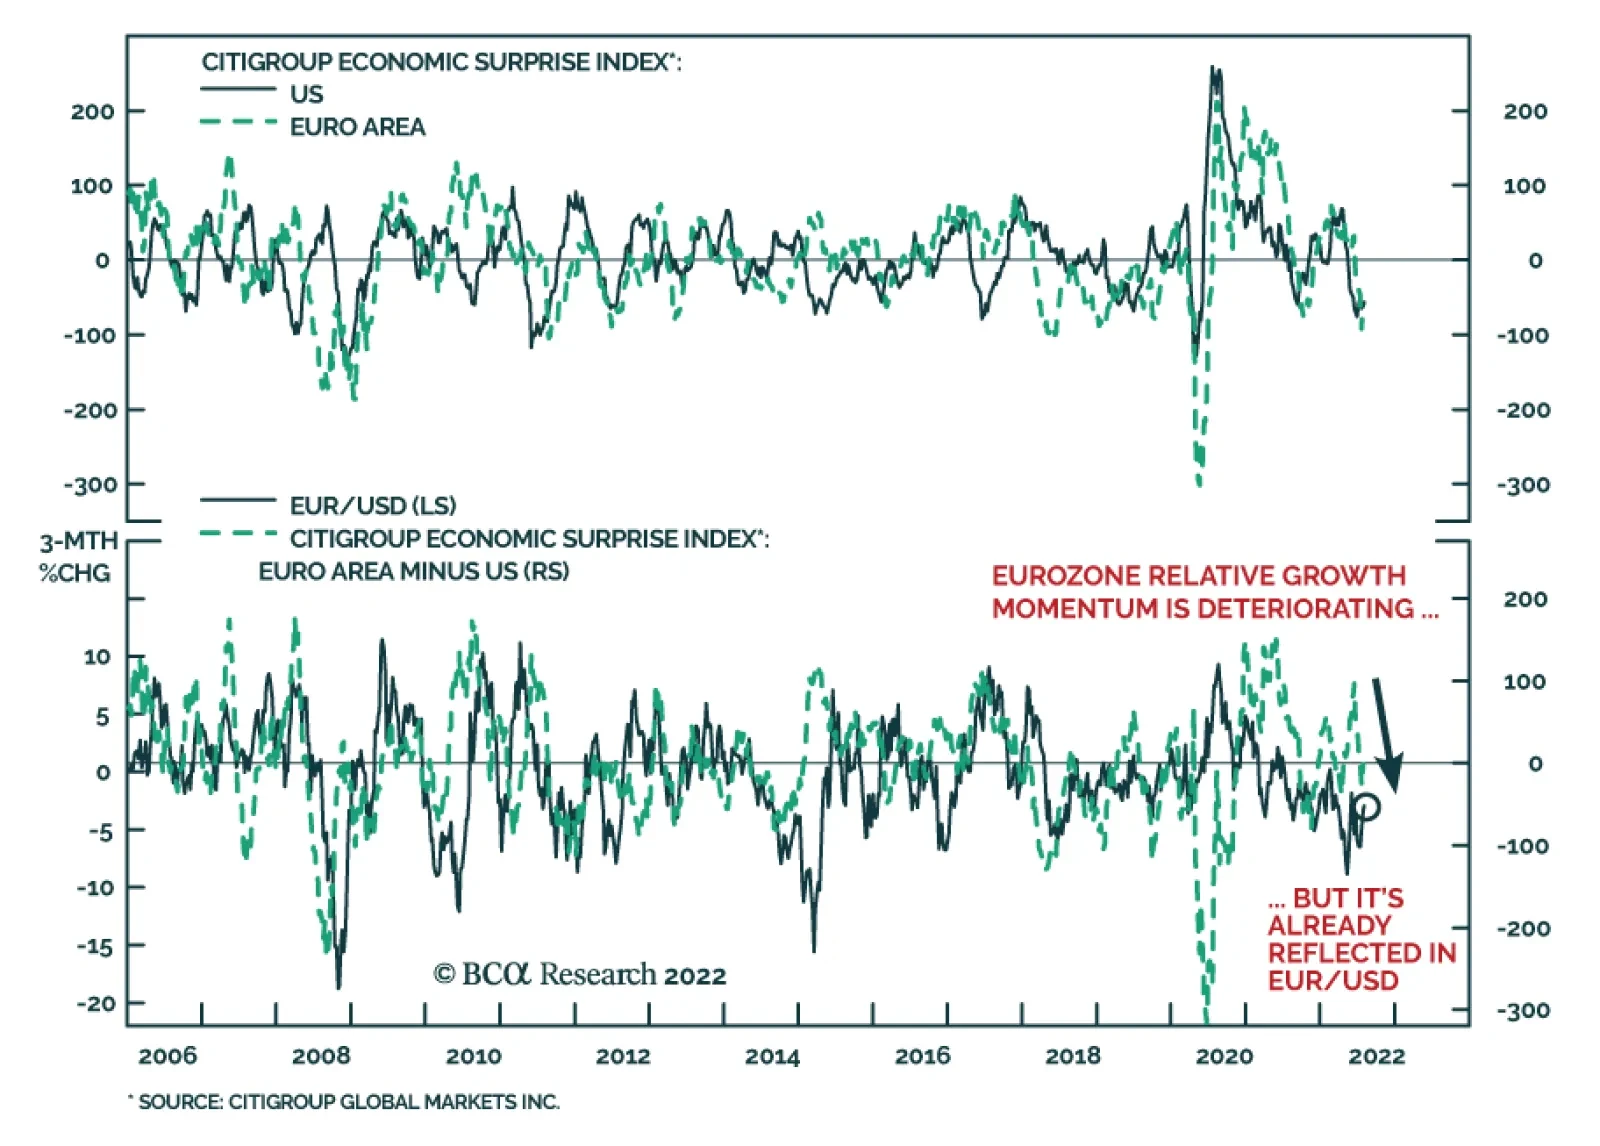
The Citigroup economic surprise indices for the US and the Euro Area are both deep in negative territory. Although the US index was first to cross below 0 in mid-May, the Eurozone measure turned negative towards the end of June and has recently been…
BCA Research’s Geopolitical Strategy service concludes that the US-China confrontation over Taiwan could cause a dramatic escalation in strategic tensions. Speaker of the US House of Representatives Nancy Pelosi arrived in Taiwan on Tuesday, defying…
Listen to a short summary of this report. Executive Summary Investors Are Pricing In A Much More Aggressive Tightening Cycle Than At The Start Of The Year
Investors Are Pricing In A Much More Aggressive Tightening Cycle Than At The Start Of The Year
Investors Are Pricing In A Much More Aggressive Tightening Cycle Than At The Start Of The Year
Following last week’s sharp post-FOMC rally, we shifted our 12-month equity recommendation from overweight to neutral. We expect stock prices to rise further during the remainder of the year as US recession risks abate, but then to give up most of their gains early next year as it becomes clear that the Fed has no intention of cutting rates and may even need to raise rates. We have more conviction that US growth will hold up over the next 12 months than we do that inflation will fall as fast as the Fed expects or the breakevens imply. These varying degrees of conviction stem from the same reason: The neutral rate of interest in the US is higher than widely believed. A high neutral rate implies that it may take significant monetary tightening to slow the economy. That reduces the risk of a recession in the near term, but it raises the risk that inflation will remain elevated. A recession is now our base case for the euro area. However, we expect the European economy to bounce back early next year, as gas supplies increase and fiscal policy turns more stimulative. The euro has significant upside over the long haul. Bottom Line: Stocks will continue to recover over the coming months before facing renewed pressure early next year. We are retaining our tactical (3-month) overweight on global equities but are shifting our 12-month recommendation to neutral. Taking Some Chips Off the Table Following last week’s sharp post-FOMC rally, we shifted our cyclical 12-month equity recommendation from overweight to neutral. This note lays out the key considerations in a Q&A format. Q: Have any of your underlying views about the economy changed recently or has the market simply moved towards pricing in your benign outlook? A: Mainly the latter. While we continue to see a higher-than-normal risk of a US recession over the next 12 months, our baseline (60% odds) remains no recession. Q: Many would say that we are in a recession already. A: While two consecutive quarters of negative growth does not officially constitute a recession, it is correct to say that every time real GDP has contracted for two quarters in a row, the NBER has ultimately deemed that episode a recession (Chart 1). Chart 1In The Past, Two Consecutive Quarters Of Negative Growth Have Always Coincided With A Recession
In The Past, Two Consecutive Quarters Of Negative Growth Have Always Coincided With A Recession
In The Past, Two Consecutive Quarters Of Negative Growth Have Always Coincided With A Recession
That said, one should keep two things in mind. First, preliminary GDP estimates are subject to significant revisions. According to our calculations, there is a 35% chance that real GDP growth in Q2 will ultimately be revised into positive territory (Chart 2). Even Q1 may eventually show positive growth. Real Gross Domestic Income (GDI), which conceptually should equal GDP, rose by 1.8% in Q1. Chart 2After Further Revisions, It Is Possible That GDP Growth Ends Up Being Positive In Q2 2022
Shifting Into Neutral: A Q&A
Shifting Into Neutral: A Q&A
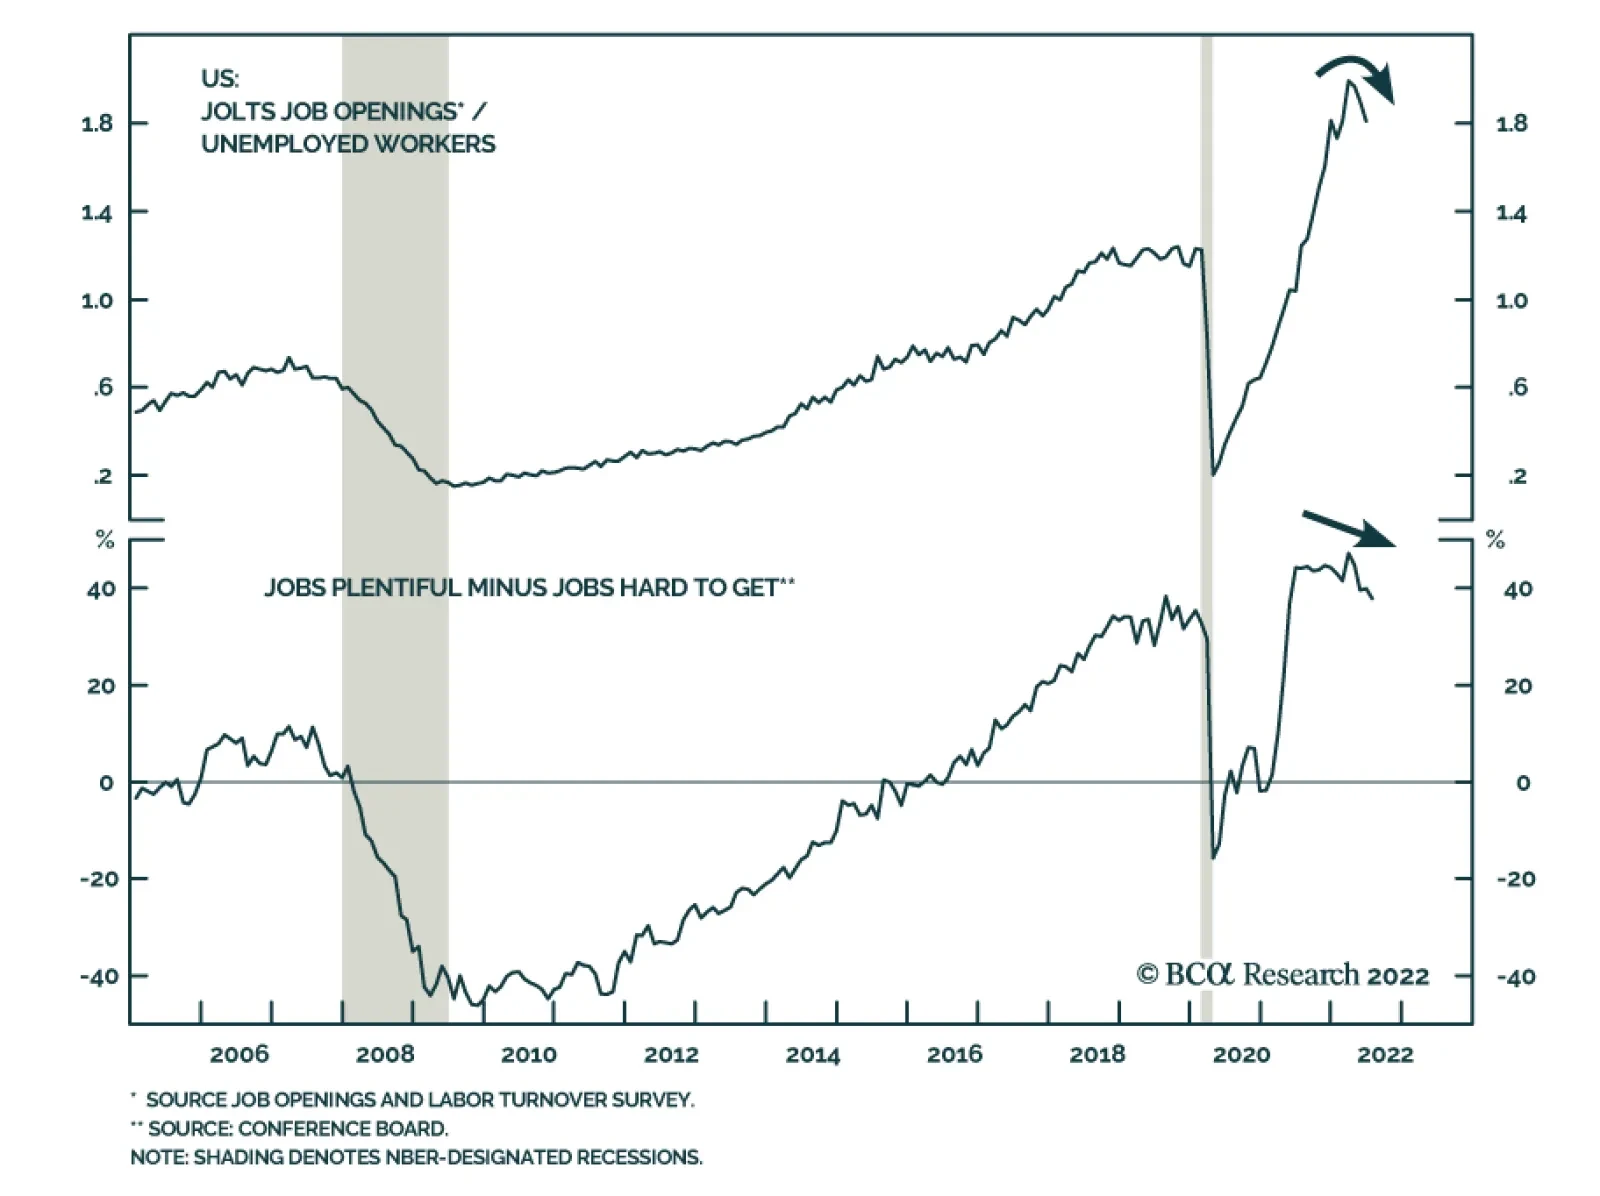
Second, every single US recession has seen an increase in the unemployment rate (Chart 3). So far, that has not happened, and there is good reason to think it will not happen for some time: There are 1.8 job openings per unemployed worker (Chart 4). For the foreseeable future, most people who lose their jobs will be able to walk across the street to find a new one. Chart 3Recessions And Spikes In The Unemployment Rate Go Hand-In-Hand
Recessions And Spikes In The Unemployment Rate Go Hand-In-Hand
Recessions And Spikes In The Unemployment Rate Go Hand-In-Hand
Chart 4A High Level Of Job Openings Creates A Moat Around The Labor Market
A High Level Of Job Openings Creates A Moat Around The Labor Market
A High Level Of Job Openings Creates A Moat Around The Labor Market
Chart 5Spending On Durable Goods Has Been Normalizing Without Derailing The Economy
Spending On Durable Goods Has Been Normalizing Without Derailing The Economy
Spending On Durable Goods Has Been Normalizing Without Derailing The Economy
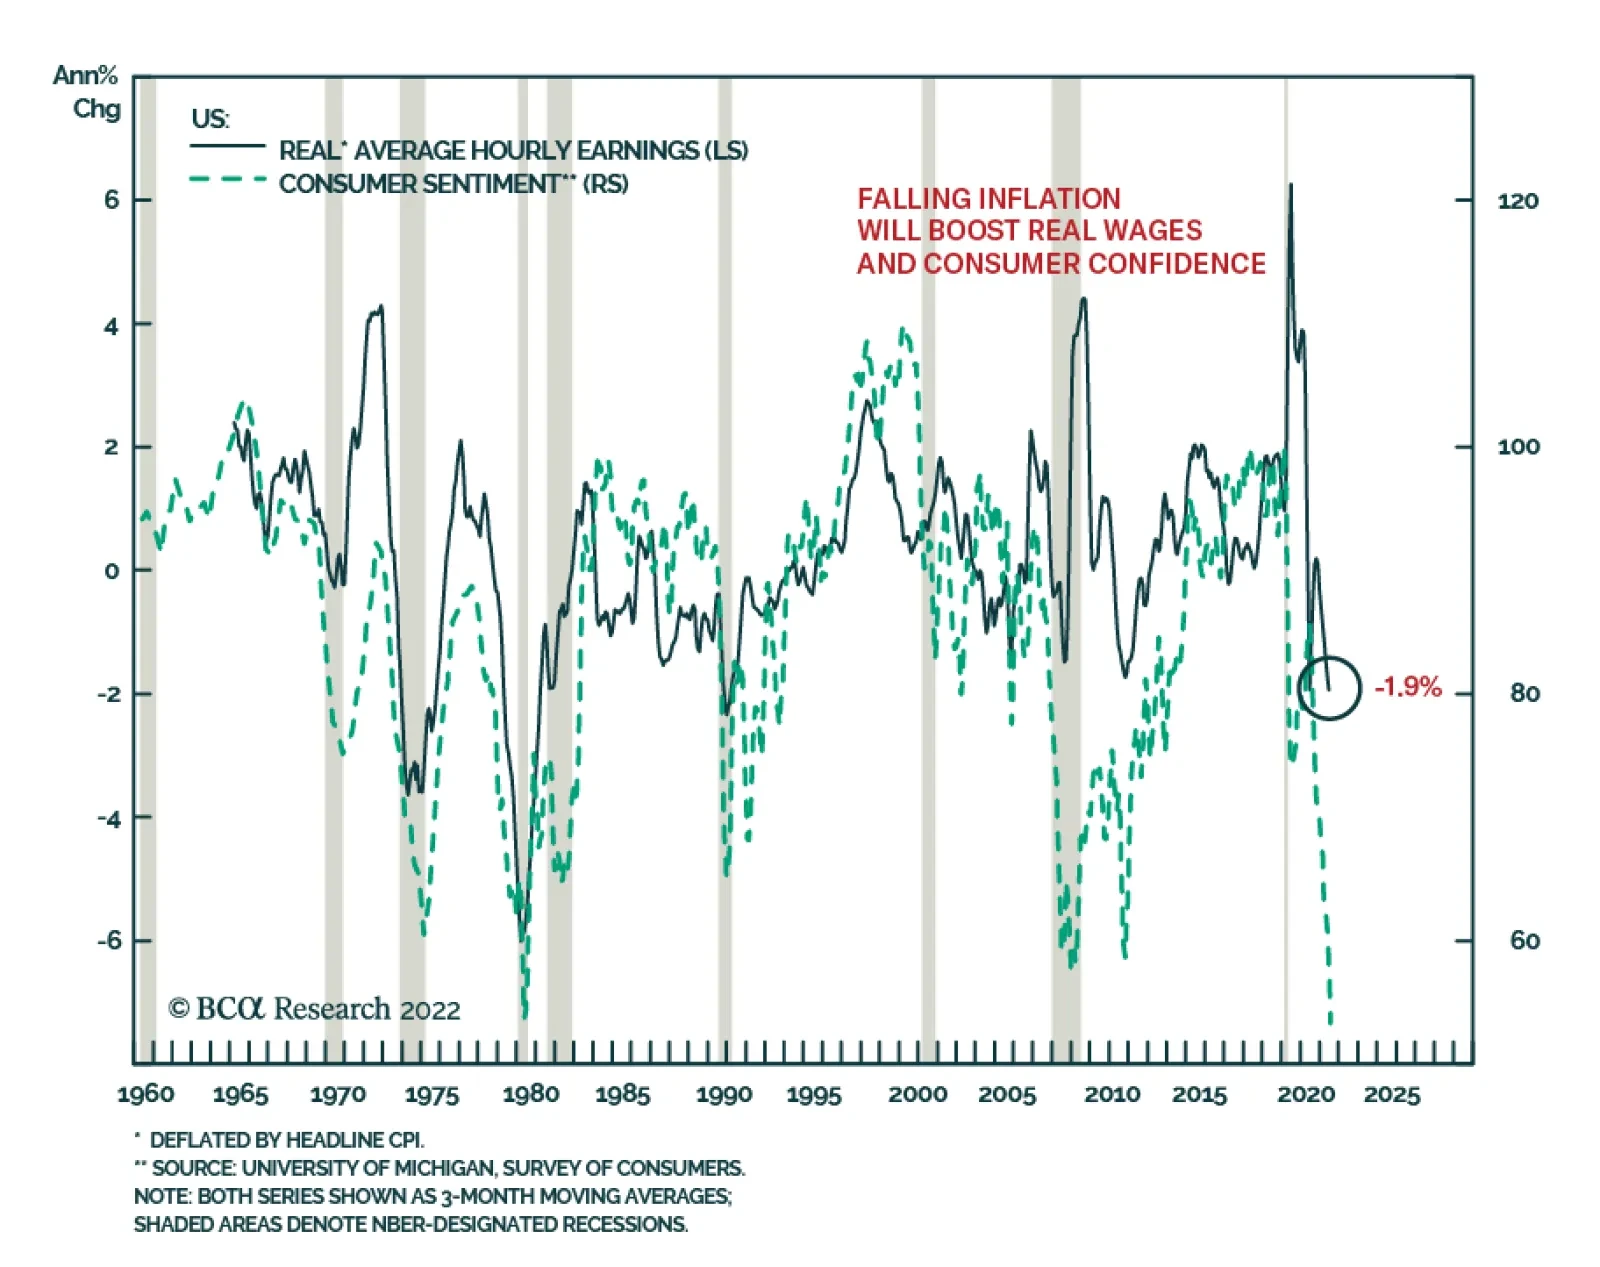
Q: Aren’t other measures of economic activity such as the ISM, consumer confidence, and homebuilder sentiment all signaling that a major slowdown is in progress? A: They are but we should take them with a grain of salt. The composition of consumer spending is shifting from goods to services. This is weighing on manufacturing output. As Chart 5 shows, goods spending has already retraced two-thirds of its pandemic surge, with no ill effects on the labor market. Consumer confidence tends to closely track real wages (Chart 6). Despite an extraordinarily tight labor market, real wages have been shrinking all year. As supply-chain bottlenecks abate, inflation will fall, allowing real wages to rise. This will bolster consumer confidence and spending. Falling gasoline prices will also boost disposable incomes. Prices at the pump have fallen for seven straight weeks and the futures market is pointing to further declines in the months ahead (Chart 7). Chart 6Falling Inflation Will Boost Real Wages And Consumer Confidence
Falling Inflation Will Boost Real Wages And Consumer Confidence
Falling Inflation Will Boost Real Wages And Consumer Confidence
Chart 7The Futures Market Points To Further Declines In Gasoline Prices
The Futures Market Points To Further Declines In Gasoline Prices
The Futures Market Points To Further Declines In Gasoline Prices
It is also critical to remember that the Fed is trying to slow the economy by tightening monetary policy. At the start of the year, investors expected the Fed funds rate to be 0.9% in early 2023. Today, they expect it to be 3.4% (Chart 8). Chart 8Investors Are Pricing In A Much More Aggressive Tightening Cycle Than At The Start Of The Year
Investors Are Pricing In A Much More Aggressive Tightening Cycle Than At The Start Of The Year
Investors Are Pricing In A Much More Aggressive Tightening Cycle Than At The Start Of The Year
Chart 9Housing Activity Should Recover Now That Mortgage Rates Have Stabilized
Housing Activity Should Recover Now That Mortgage Rates Have Stabilized
Housing Activity Should Recover Now That Mortgage Rates Have Stabilized
Rising rate expectations curb aggregate demand. This temporarily leads to lower growth. However, once rate expectations stabilize – and demand resets to a lower level – growth will tend to return to trend. The 6-month mortgage yield impulse has already turned up. This suggests that housing and other interest-rate sensitive parts of the economy will begin to recover by the end of the year (Chart 9). Admittedly, if the unemployment rate rises in response to lower aggregate demand, this could set off a vicious circle where higher unemployment leads to less spending, leading to even higher unemployment. However, as noted above, given that the current starting point is one where labor demand already exceeds labor supply by a wide margin, the odds of a such a labor market doom loop are much lower than during past downturns. Q: Does the question of whether we officially enter a recession or not really matter that much? A: It is a matter of degree. As Chart 10 shows, macroeconomic factors are by far the most important determinant of equity returns over medium-term horizons of about 12 months. As a rule of thumb, bear markets almost always coincide with recessions (Chart 11). Chart 10Macro Forces Are An Important Driver Of Equity Returns On Cyclical Horizons
Macro Forces Are An Important Driver Of Equity Returns On Cyclical Horizons (I)
Macro Forces Are An Important Driver Of Equity Returns On Cyclical Horizons (I)
Chart 11Equity Bear Markets And Recessions Go Hand-In-Hand
Equity Bear Markets And Recessions Go Hand-In-Hand
Equity Bear Markets And Recessions Go Hand-In-Hand
Chart 12Soaring Energy Prices Have Boosted Earnings Estimates This Year
Soaring Energy Prices Have Boosted Earnings Estimates This Year
Soaring Energy Prices Have Boosted Earnings Estimates This Year
Q: Are you surprised that earnings estimates have not come down faster this year as economic risks have intensified? A: Most analysts have not baked in a recession in their forecasts, so from that perspective, if our baseline scenario of no recession does not pan out, earnings estimates will almost certainly come down (Chart 12). That said, the bar for major downward earnings revisions is quite high. This is partly because we think that if a recession does occur, it is likely to be a mild one. It is also because earnings are reported in nominal terms. In contrast to real GDP, nominal GDP grew by 6.6% in Q1 and 7.8% in Q2. Q: Let’s turn to interest rates. Why do you think the Fed will not cut rates next year as markets are discounting? A: It all boils down to the neutral rate of interest. In past reports, we made the case that the neutral rate in the US is higher than widely believed. The fact that job vacancies are so plentiful provides strong evidence in favor of our thesis. If the neutral rate were low, the labor market would not have overheated. But it did, implying that monetary policy must have been exceptionally accommodative. The good news for investors is that a high neutral rate implies that the Fed is unlikely to induce a recession by raising rates in accordance with its dot plot. That reduces the risk of a recession in the near term. The bad news is that a high neutral rate will essentially preclude the Fed from cutting rates next year. The economy will simply be too strong for that. Worse still, if the Fed is too slow in bringing rates to neutral, inflation – which is likely to fall over the coming months as supply-chain pressures ease – could reaccelerate at some point next year. That could force the Fed to start hiking rates again. Chart 13Real Yields Have Scope To Rise Further
Real Yields Have Scope To Rise Further
Real Yields Have Scope To Rise Further
Q: What is your estimate for the neutral rate in the US? A: In the past, we have written that the neutral rate in the US is around 3.5%-to-4%. However, I must admit, I’m not a big fan of this formulation. Real rates matter more for economic growth than nominal rates, and long-term rates matter more than short-term rates. Thus, a better question is what level of real long-term bond yields is consistent with stable inflation and full employment. Based on research we have published in the past, my best bet is that the neutral long-term real bond yield is between 1.5%-and-2%. That is substantially above the 10-year TIPS yield (0.27%) and the 30-year TIPS yield (0.79%) (Chart 13). Given that the yield curve is inverted, the Fed may have to raise policy rates well above 4% in order to drag up the long end of the curve. It is a bit like how oil traders say you need to lift spot crude prices in order to push up long-term futures prices when the oil curve is backwardated. Chart 14Investors Expect Inflation To Fall Rapidly Over The Next Few Years
Shifting Into Neutral: A Q&A
Shifting Into Neutral: A Q&A
Q: So presumably then, you would favor a short duration position in fixed-income portfolios? A: Yes, if the whole yield curve shifts higher, you will lose a lot less money in short-term bonds than in long-term bonds. Relatedly, we would overweight TIPS versus nominal bonds. The TIPS market is pricing in a very rapid decline in inflation over the next few years (Chart 14). The widely followed 5-year, 5-year forward TIPS inflation breakeven rate is trading at 2.28%, toward the bottom end of the Fed’s comfort zone of 2.3%-to-2.5%.1 Q: What about credit? A: US high-yield bonds are pricing in a default rate of 6.1% over the next 12 months. This is up from an expected default rate of 3.8% at the start of the year and is significantly higher than the trailing 12-month default rate of 1.4%. In a typical recession, high-yield default rates rise above 8% (Chart 15). Thus, spreads would probably increase if the US entered a recession. That said, it is important to keep in mind that many corporate borrowers took advantage of very low long-term yields over the past few years to extend the maturity of their debt. Only 7% of US high-yield debt, and less than 1% of investment-grade debt, held in corporate credit ETFs matures in less than two years. This suggests that the default cycle, if it were to occur, would be less intense and more elongated than previous ones. Chart 15High-Yield Bonds Are Pricing In Higher Default Rates
High-Yield Bonds Are Pricing In Higher Default Rates
High-Yield Bonds Are Pricing In Higher Default Rates
On balance, we recommend a modest overweight to high-yield bonds within fixed-income portfolios. Chart 16High Energy Prices Are Weighing On The European Economy
High Energy Prices Are Weighing On The European Economy
High Energy Prices Are Weighing On The European Economy
Q: Let’s turn to non-US markets. The dollar has strengthened a lot against the euro this year as the economic climate in Europe has soured. Can Europe avoid a recession? A: Probably not. European natural gas prices are back near record highs and business surveys increasingly point to recession (Chart 16). That said, the nature of Europe’s recession could turn out to be quite different from what many expect. There are a few useful parallels between the predicament Europe finds itself in now and what the global economy experienced early on during the pandemic. Just like the Novel coronavirus, as it was called back then, represented an external shock to the global economy, the partial cut-off in Russian energy flows represents an external shock to the European economy. Policymakers in advanced economies responded to the pandemic by showering their economies with various income-support measures. European governments will react similarly to the energy crunch. In fact, the political incentive to respond generously is even greater this time around because the last thing European leaders want is for Putin to succeed in his efforts to destabilize the region. For its part, the ECB will set an extremely low bar for buying Italian bonds and the debt of other vulnerable economies. Just like the world eventually deployed vaccines, Europe is taking steps to inoculate itself from its dangerous addiction to Russian energy. The official REPowerEU plan seeks to displace two-thirds of Russian natural gas imports by the end of the year. While some aspects of the plan are probably too optimistic, others may not be optimistic enough. For example, the plan does not envision increased energy production from coal-fired plants, which is something that even the German Green Party has now signed on to. The euro is trading near parity to the dollar because investors expect growth in the common-currency bloc to remain depressed for an extended period of time. If investors start to price in a more forceful recovery, the euro will rally. Q: China’s economy remains in the doldrums. Could that undermine your sanguine view on the global economy? A: China’s PMI data disappointed in July, as anxiety over the zero-Covid policy and a sagging property market continued to weigh on activity (Chart 17). We do not expect any change to the zero-Covid policy until the conclusion of the Twentieth Party Congress later this year. After that, the government is likely to ease restrictions, which will help to reignite growth. Chart 17The Zero-Covid Policy And Slumping Property Market Are Weighing On Chinese Economic Activity
The Zero-Covid Policy And Slumping Property Market Are Weighing On Chinese Economic Activity
The Zero-Covid Policy And Slumping Property Market Are Weighing On Chinese Economic Activity
Chart 18China Faces A Structural Decline In The Demand For Housing
China Faces A Structural Decline In The Demand For Housing
China Faces A Structural Decline In The Demand For Housing
The property market has probably entered a secular downturn (Chart 18). If a weakening property market were to cause a banking crisis, similar to what happened in the US and parts of Europe in 2008, this would destabilize the global economy. However, we doubt that this will happen given the control the government has over the banking system. In contrast, a soft landing for the Chinese real estate market might turn out to be a welcome development for the global economy, as less Chinese property investment would keep a lid on commodity prices, thus helping to ease inflationary pressures. Peter Berezin Chief Global Strategist peterb@bcaresearch.com Follow me on LinkedIn & Twitter Footnotes 1 The Federal Reserve targets an average inflation rate of 2% for the Personal Consumption Expenditures (PCE) index. The TIPS breakeven is based on the CPI index. Due to compositional differences between the two indices, CPI inflation has historically averaged 30-to-50 basis points higher than PCE inflation. This is why the Fed effectively targets a CPI inflation rate of 2.3%-to-2.5%. View Matrix
Image
Special Trade Recommendations Current MacroQuant Model Scores
Shifting Into Neutral: A Q&A
Shifting Into Neutral: A Q&A
Highlights Chart 1Are Expectations Too Dovish?
Are Expectations Too Dovish?
Are Expectations Too Dovish?
The bond market is now priced for the fed funds rate to peak at 3.44% in January and then head back down to 2.79% by the end of 2023 (Chart 1). We strongly push back against the idea that the Fed will be cutting rates in 2023. While inflation will fall during the next few months, strong wage growth suggests that it will be sticky above the Fed’s 2% target for some time. What’s more, comments from yesterday’s ISM PMI release show that “companies continue to hire at strong rates”. Our sense is that it will be difficult to push the unemployment rate up significantly even as economic activity slows. Given that inflation is likely to fall during the next few months, we recommend keeping portfolio duration ‘at benchmark’ for the time being. However, we are now actively looking for an opportunity to reduce portfolio duration and we could change our recommended allocation in the near term. Stay tuned. Feature Table 1 Recommended Portfolio Specification Table 2Fixed Income Sector Performance
Don't Bet On A Fed Pivot
Don't Bet On A Fed Pivot
Table 3A Corporate Sector Relative Valuation And Recommended Allocation* Table 3BCorporate Sector Risk Vs. Reward*
Don't Bet On A Fed Pivot
Don't Bet On A Fed Pivot
Investment Grade: Underweight Chart 2Investment Grade Market Overview
Investment Grade Market Overview
Investment Grade Market Overview
Investment grade corporate bonds outperformed the duration-equivalent Treasury index by 109 basis points in July, bringing year-to-date excess returns up to -274 bps. The average index option-adjusted spread tightened 11 bps on the month and it currently sits at 144 bps. Similarly, our quality-adjusted 12-month breakeven spread moved down to its 54th percentile since 1995 (Chart 2). A report from a few months ago made the case for why investors should underweight investment grade corporate bonds on a 6-12 month investment horizon.1 The main rationale for this recommendation is that the slope of the Treasury curve suggests that the credit cycle is in its late stages. Corporate bond performance tends to be weak during periods when the yield curve is very flat or inverted. Despite our underweight 6-12 month investment stance, we wouldn’t be surprised to see spreads narrow further during the next couple of months as inflation finally shows signs of rolling over. That said, the persistent removal of monetary accommodation and inverted yield curve will limit how much spreads can compress. A recent report dug deeper into the corporate bond space and concluded that investment grade-rated Energy bonds offer exceptional value on a 6-12 month horizon.2 That report also concluded that long maturity investment grade corporates are attractively priced relative to short maturity bonds. High-Yield: Neutral Chart 3High-Yield Market Overview
High-Yield Market Overview
High-Yield Market Overview
High-Yield outperformed the duration-equivalent Treasury index by 434 basis points in July, bringing year-to-date excess returns up to -493 bps. The average index option-adjusted spread tightened 100 bps on the month to reach 469 bps, 100 bps above the 2017-19 average and 62 bps below the 2018 peak. The 12-month spread-implied default rate – the default rate that is priced into the junk index assuming a 40% recovery rate on defaulted debt and an excess spread of 100 bps – moved lower in July. It currently sits at 6.2% (Chart 3). As is the case with investment grade, there’s a good chance that high-yield spreads can continue their relief rally during the next couple of months as inflation falls. Due to the flatness of the yield curve, we think it will be difficult for spreads to move below the average seen during the last tightening cycle (2017-19). However, even a move back to average 2017-19 levels would equate to roughly 5% of excess return for the junk index if it is realized over a six month period. This potential return is the main reason to prefer high-yield over investment grade in a US bond portfolio. While we maintain a neutral (3 out of 5) allocation to high-yield for now, we will be inclined to downgrade the sector if spreads tighten to the 2017-19 average or if core inflation falls back to 4%.3 MBS: Underweight Chart 4MBS Market Overview
MBS Market Overview
MBS Market Overview
Mortgage-Backed Securities outperformed the duration-equivalent Treasury index by 129 basis points in July, bringing year-to-date excess returns up to -44 bps. We discussed the outlook for Agency MBS in a recent report.4 We noted that MBS’s poor performance in 2021 and early-2022 was driven by duration extension. Fewer homeowners refinanced their loans as mortgage rates rose, and the MBS index’s average duration increased (Chart 4). But now, the index’s duration extension is at its end. The average convexity of the MBS index is close to zero (panel 3), meaning that duration is now insensitive to changes in rates. This is because hardly any homeowners have the incentive to refinance at current mortgage rates. The implication is that excess MBS returns will be stronger going forward. That said, we still don’t see enough value in MBS spreads to increase our recommended allocation. The average index spread for conventional 30-year Agency MBS remains close to its lowest level since 2000 (panel 4). At the coupon level, we observe that low-coupon MBS have much higher duration than high-coupon MBS and that convexity is close to zero for the entire coupon stack. This makes the relative coupon trade a direct play on bond yields. We had been recommending that investors favor low-coupon (1.5%-2.5%) MBS over high-coupon (3%-4.5%) MBS to take advantage of falling bond yields (bottom panel). Now that bond yields have fallen, we think it is wise to take profits on this position and shift to a neutral allocation across the coupon stack. Emerging Market Bonds (USD): Underweight Chart 5Emerging Markets Overview
Emerging Markets Overview
Emerging Markets Overview
Emerging Market bonds outperformed the duration-equivalent Treasury index by 31 basis points in July, bringing year-to-date excess returns up to -708 bps. EM Sovereigns outperformed the Treasury benchmark by 155 bps on the month, bringing year-to-date excess returns up to -784 bps. The EM Corporate & Quasi-Sovereign Index underperformed by 45 bps, dragging year-to-date excess returns down to -659 bps. The EM Sovereign Index outperformed the duration-equivalent US corporate bond index by 53 bps in July. The yield differential between EM sovereigns and duration-matched US corporates remains negative (Chart 5). As such, we continue to recommend a maximum underweight allocation to EM sovereigns. The EM Corporate & Quasi-Sovereign Index underperformed duration-matched US corporates by 116 bps in July. The index continues to offer a significant yield advantage versus duration-matched US corporates (panel 4). As such, we continue to recommend a neutral (3 out of 5) allocation to the sector. EM currencies continue to struggle versus the US dollar (bottom panel), and depreciating exchange rates will continue to act as a headwind for USD-denominated EM bond performance. Our Emerging Market Strategy service expects continued near-term weakness in EM currencies.5 Municipal Bonds: Overweight Chart 6Municipal Market Overview
Municipal Market Overview
Municipal Market Overview
Municipal bonds underperformed the duration-equivalent Treasury index by 2 basis points in July, dragging year-to-date excess returns down to -169 bps (before adjusting for the tax advantage). We view the municipal bond sector as better placed than most to cope with the recent bout of spread volatility. As we noted in a recent report, state & local government revenue growth has been strong, but governments have been slow to hire.6 The result is that net state & local government savings are incredibly high (Chart 6) and it will take some time to deplete those coffers, even as economic growth slows and federal fiscal thrust turns to drag. On the valuation front, munis have cheapened up relative to both Treasuries and corporates during the past few months. The 10-year Aaa Muni / Treasury yield ratio is currently 85%, up significantly from its 2021 trough of 55%. The yield ratio between 12-17 year munis and duration-matched corporate bonds is also up significantly off its lows (panel 2). We reiterate our overweight allocation to municipal bonds within US fixed income portfolios, and we continue to have a strong preference for long-maturity munis. The yield ratio between 17-year+ General Obligation Municipal bonds and duration-matched US corporates is 89%. The same measure for 17-year+ Revenue bonds stands at 95%, just below parity even without considering municipal debt’s tax advantage. Treasury Curve: Buy 2-Year Bullet Versus Cash/5 Barbell Chart 7Treasury Yield Curve Overview
Treasury Yield Curve Overview
Treasury Yield Curve Overview
The Treasury curve bull-flattened out to the 10-year maturity point in July. The 2-year/10-year Treasury slope flattened 28 bps on the month while the 5-year/30-year slope steepened 17 bps. The 2/10 and 5/30 slopes now stand at -22 bps and +30 bps, respectively. We closed our position long the 5-year bullet versus a duration-matched 2/10 barbell in a recent report.7 The reason for the move is that the 5-year note no longer offers a yield advantage versus the 2/10 barbell. That 2/5/10 butterfly spread has continued to compress during the past three weeks, and it now sits at -10 bps (Chart 7). In that same report we initiated a new recommendation: buy the 2-year bullet versus a duration-matched barbell consisting of cash and the 5-year note. This position offers a much more attractive yield advantage of 51 bps (bottom panel). Our new position will deliver strong returns if the 2-year/5-year Treasury slope steepens, something that is likely to occur if the market prices out the rate cuts that are currently discounted for next year. This would be in line with our base case expectation. However, if our base case is wrong and a deep recession forces the Fed to cut rates during the next 6-12 months, then our position should also benefit from a bull-steepening of the 2/5 slope. TIPS: Neutral Chart 8TIPS Market Overview
TIPS Market Overview
TIPS Market Overview
TIPS outperformed the duration-equivalent nominal Treasury index by 270 basis points in July, bringing year-to-date excess returns up to +256 bps. The 10-year TIPS breakeven inflation rate rose 20 bps on the month, moving back above the Fed’s 2.3% - 2.5% comfort zone (Chart 8). Meanwhile, our TIPS Breakeven Valuation Indicator now shows that TIPS are modestly cheap versus nominals (panel 2). We upgraded TIPS from underweight to neutral in a recent report.8 In that report we noted that TIPS valuation had improved considerably in recent months as the cost of inflation compensation embedded in the market trended down. For example, the 1-year CPI swap rate currently sits at 3.94%, down from a peak of 5.9% in June. Given our expectation that core inflation will be sticky around 4%, the cost of inflation compensation looks a lot more compelling than it did even a month ago. We also closed our long-standing recommendation to short 2-year TIPS in a report published two weeks ago.9 We made this change after the 2-year TIPS yield moved into positive territory for the first time since 2020, up from a 2021 low of -3.07% (bottom panel). We are not yet ready to upgrade TIPS to overweight, despite much improved valuation, because headline inflation is much more likely to trend lower than higher during the next few months. That said, if current valuations persist, we will likely be looking to upgrade TIPS once more before the end of the year. ABS: Overweight Chart 9ABS Market Overview
ABS Market Overview
ABS Market Overview
Asset-Backed Securities underperformed the duration-equivalent Treasury index by 10 basis points in July, dragging year-to-date excess returns down to -52 bps. Aaa-rated ABS underperformed by 10 bps on the month, dragging year-to-date excess returns down to -43 bps. Non-Aaa ABS underperformed by 11 bps on the month, dragging year-to-date excess returns down to -104 bps. During the past two years, substantial federal government support for household incomes caused US households to build up an extremely large buffer of excess savings. Nowhere is this more evident than in the steep drop in the amount of outstanding credit card debt that was witnessed in 2020 and 2021 (Chart 9). In 2022, consumers have started to re-lever. The personal savings rate was just 5.1% in June and the amount of outstanding credit card debt has recovered to its pre-COVID level (bottom panel). But while household balance sheets are starting to deteriorate, they remain exceptionally strong in level terms. In other words, it will be some time before we see enough deterioration to cause a meaningful uptick in consumer credit delinquencies. Investors should remain overweight consumer ABS and should take advantage of the high quality of household balance sheets by moving down the quality spectrum, favoring non-Aaa rated securities over Aaa-rated ones. Non-Agency CMBS: Overweight Chart 10CMBS Market Overview
CMBS Market Overview
CMBS Market Overview
Non-Agency Commercial Mortgage-Backed Securities outperformed the duration-equivalent Treasury index by 19 basis points in July, bringing year-to-date excess returns up to -175 bps. Aaa Non-Agency CMBS outperformed Treasuries by 18 bps on the month, bringing year-to-date excess returns up to -123 bps. Non-Aaa Non-Agency CMBS outperformed by 22 bps on the month, bringing year-to-date excess returns up to -319 bps. CMBS spreads remain wide compared to other similarly risky spread products and are currently slightly above their historic averages. Further, last week’s Q2 GDP report confirmed that commercial real estate (CRE) investment remains weak (Chart 10). Weak investment will continue to support CRE price appreciation which will benefit CMBS spreads. Agency CMBS: Overweight Agency CMBS underperformed the duration-equivalent Treasury index by 24 bps in July, dragging year-to-date excess returns down to -15 bps. The average index option-adjusted spread widened 9 bps on the month. It currently sits at 54 bps, close to its long-term average (bottom panel). Agency CMBS spreads also continue to look attractive compared to other similarly risky spread products. Stay overweight. Appendix A: The Golden Rule Of Bond Investing We follow a two-step process to formulate recommendations for bond portfolio duration. First, we determine the change in the federal funds rate that is priced into the yield curve for the next 12 months. Second, we decide – based on our assessments of the economy and Fed policy – whether the change in the fed funds rate will exceed or fall short of what is priced into the curve. Most of the time, a correct answer to this question leads to the appropriate duration call. We call this framework the Golden Rule Of Bond Investing, and we demonstrated its effectiveness in the US Bond Strategy Special Report, “The Golden Rule Of Bond Investing”, dated July 24, 2018. Chart 11 illustrates the Golden Rule’s track record by showing that the Bloomberg Barclays Treasury Master Index tends to outperform cash when rate hikes fall short of 12-month expectations, and vice-versa. At present, the market is priced for 78 basis points of rate hikes during the next 12 months. Chart 11The Golden Rule's Track Record
The Golden Rule's Track Record
The Golden Rule's Track Record
We can also use our Golden Rule framework to make 12-month total return and excess return forecasts for the Bloomberg Barclays Treasury index under different scenarios for the fed funds rate. Excess returns are relative to the Bloomberg Barclays Cash index. To forecast total returns we first calculate the 12-month fed funds rate surprise in each scenario by comparing the assumed change in the fed funds rate to the current value of our 12-month discounter. This rate hike surprise is then mapped to an expected change in the Treasury index yield using a regression based on the historical relationship between those two variables. Finally, we apply the expected change in index yield to the current characteristics (yield, duration and convexity) of the Treasury index to estimate total returns on a 12-month horizon. The below tables present those results, along with excess returns for a front-loaded and a back-loaded rate hike scenario. Excess returns are calculated by subtracting assumed cash returns in each scenario from our total return projections.
Don't Bet On A Fed Pivot
Don't Bet On A Fed Pivot
Appendix B: Butterfly Strategy Valuations The following tables present the current read-outs from our butterfly spread models. We use these models to identify opportunities to take duration-neutral positions across the Treasury curve. The following two Special Reports explain the models in more detail: US Bond Strategy Special Report, “Bullets, Barbells And Butterflies”, dated July 25, 2017, available at usbs.bcaresearch.com US Bond Strategy Special Report, “More Bullets, Barbells And Butterflies”, dated May 15, 2018, available at usbs.bcaresearch.com Table 4 shows the raw residuals from each model. A positive value indicates that the bullet is cheap relative to the duration-matched barbell. A negative value indicates that the barbell is cheap relative to the bullet. Table 4Butterfly Strategy Valuation: Raw Residuals In Basis Points (As Of July 29, 2022)
Don't Bet On A Fed Pivot
Don't Bet On A Fed Pivot
Table 5 scales the raw residuals in Table 4 by their historical means and standard deviations. This facilitates comparison between the different butterfly spreads. Table 5Butterfly Strategy Valuation: Standardized Residuals (As Of July 29, 2022)
Don't Bet On A Fed Pivot
Don't Bet On A Fed Pivot
Table 6 flips the models on their heads. It shows the change in the slope between the two barbell maturities that must be realized during the next six months to make returns between the bullet and barbell equal. For example, a reading of 34 bps in the 5 over 2/10 cell means that we would only expect the 5-year to outperform the 2/10 if the 2/10 slope steepens by more than 34 bps during the next six months. Otherwise, we would expect the 2/10 barbell to outperform the 5-year bullet. Table 6Discounted Slope Change During Next 6 Months (BPs)
Don't Bet On A Fed Pivot
Don't Bet On A Fed Pivot
Appendix C: Excess Return Bond Map The Excess Return Bond Map is used to assess the relative risk/reward trade-off between different sectors of the US bond market. It is a purely computational exercise and does not impose any macroeconomic view. The Map’s vertical axis shows 12-month expected excess returns. These are proxied by each sector’s option-adjusted spread. Sectors plotting further toward the top of the Map have higher expected returns and vice-versa. Our novel risk measure called the “Risk Of Losing 100 bps” is shown on the Map’s horizontal axis. To calculate it, we first compute the spread widening required on a 12-month horizon for each sector to lose 100 bps or more relative to a duration-matched position in Treasury securities. Then, we divide that amount of spread widening by each sector’s historical spread volatility. The end result is the number of standard deviations of 12-month spread widening required for each sector to lose 100 bps or more versus a position in Treasuries. Lower risk sectors plot further to the right of the Map, and higher risk sectors plot further to the left. Chart 12Excess Return Bond Map (As Of July 29, 2022)
Don't Bet On A Fed Pivot
Don't Bet On A Fed Pivot
Ryan Swift US Bond Strategist rswift@bcaresearch.com Footnotes 1 Please see US Bond Strategy / Global Fixed Income Strategy Special Report, “Turning Defensive On US Corporate Bonds”, dated April 12, 2022. 2 Please see US Bond Strategy / Global Fixed Income Strategy Special Report, “Looking For Opportunities In US & European Corporates After The Recent Selloff”, dated May 31, 2022. 3 For more details on this call please see US Bond Strategy Weekly Report, “When The Dual Mandates Clash”, dated June 28, 2022. 4 Please see US Bond Strategy Weekly Report, “The Bond Market Implications Of A 5% Mortgage Rate”, dated April 26, 2022. 5 Please see Emerging Markets Strategy Charts That Matter, “Beware Of Another Downleg In Risk Assets”, dated June 30, 2022. 6 Please see US Bond Strategy Weekly Report, “Echoes Of 2018”, dated May 24, 2022. 7 Please see US Bond Strategy / Global Fixed Income Strategy Weekly Report, “A Low Conviction US Bond Market”, dated July 12, 2022. 8 Please see US Bond Strategy / Global Fixed Income Strategy Weekly Report, “A Low Conviction US Bond Market”, dated July 12, 2022. 9 Please see US Bond Strategy Weekly Report, “Three Conjectures About The US Economy”, dated July 19, 2022. Recommended Portfolio Specification Other Recommendations Treasury Index Returns Spread Product Returns