United States
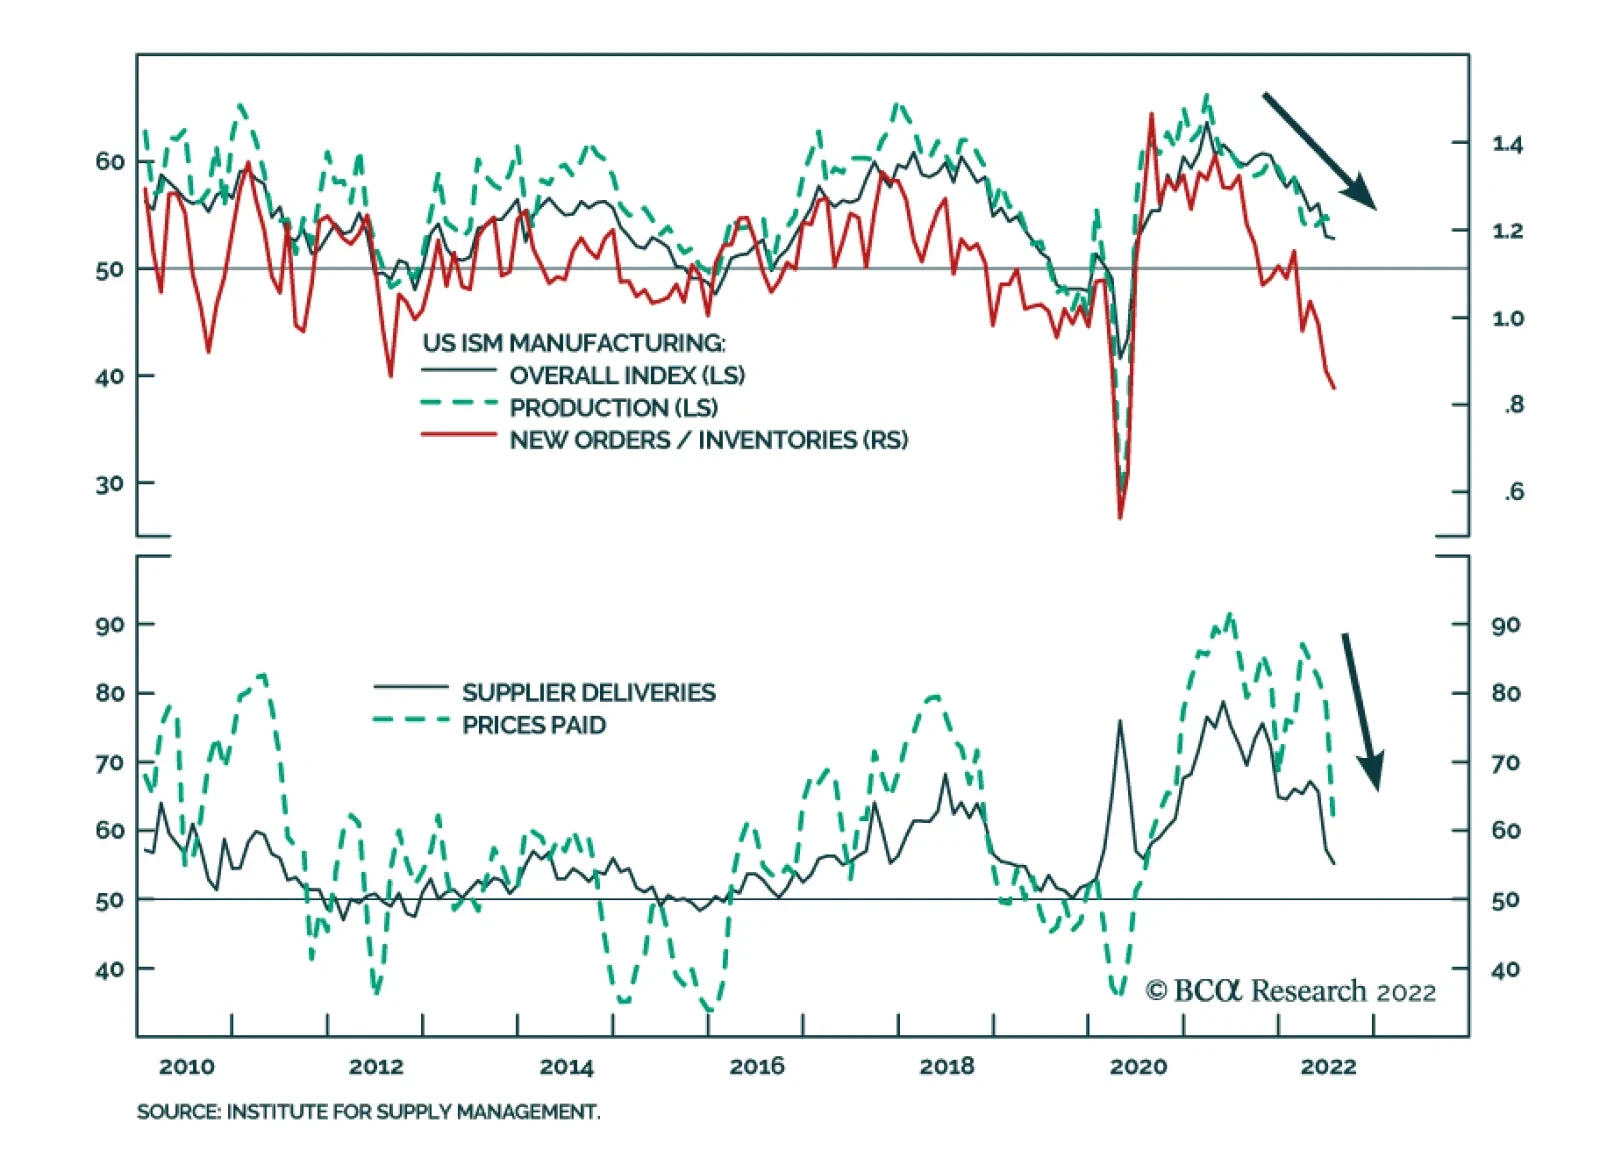
The ISM PMI suggests that manufacturing activity continued to expand at a steady pace in July. The headline index was broadly unchanged at 52.8 (versus 53.0 in June). This figure is in line with the S&P Global’s US Manufacturing PMI’s 52.2 print (see The…

Executive Summary Biden Can Take Risks Ahead Of Midterms
The Fourth Taiwan Strait Crisis
The Fourth Taiwan Strait Crisis
News reports suggest House Speaker Nancy Pelosi will travel to Taiwan and meet with Taiwanese President Tsai Ing-wen in the coming days. China has promised military counter-measures if she visits. Structural factors suggest US-China tensions over Taiwan could explode: China’s reversion to autocracy and hawkish foreign policy, Taiwan’s assertion of autonomy, and the US’s political instability and foreign policy reactiveness. Cyclical factors also suggest that tensions could escalate: China’s instability in the wake of Covid-19, the ramifications of Russia’s invasion of Ukraine, the budding Russo-Chinese alliance, the Biden administration’s domestic political vulnerability, and the Xi administration’s domestic political vulnerability. In particular, Xi cannot back down. A diplomatic crisis or military showdown is likely in the short run but not yet a full-scale war. Taiwan is harder to invade than Ukraine, the US is not attempting a radical boost to Taiwan’s military, Taiwan is not moving toward formal independence, and the Chinese economy is not yet collapsing beyond all hope. However, over the long run we fear that a Taiwan war is more likely than not. Tactically investors should prefer government bonds to equities, US equities to global, defensive sectors to cyclicals, and safe havens to risky assets. Investors should short Chinese and Taiwanese currencies and assets. Tactical Recommendation Inception Date Return LONG US SEMICONDUCTOR & SEMI EQUIPMENT / TAIWAN EQUITIES 2022-06-23 14.6% LONG KOREA/ SHORT TAIWAN EQUITIES 2020-03-27 -23.5% Bottom Line: Tactically investors should buy safe-haven assets and await a resolution of the US-China confrontation over Taiwan, which could cause a dramatic escalation in strategic tensions. Feature A fourth Taiwan Strait crisis is likely upon us. Speaker of the US House of Representatives Nancy Pelosi will visit Taiwan during her travel around Asia Pacific this week, according to the Wall Street Journal on August 1. Chinese President Xi Jinping warned US President Joe Biden in a phone conversation on July 28 that “those who play with fire will eventually get burned,” referring specifically to US relations with Taiwan. Chinese foreign ministry officials have threatened “forceful” countermeasures if Pelosi visits the island, explicitly saying that the People’s Liberation Army would respond in some way. There is still some uncertainty over whether Pelosi will go. She delayed the trip in April. Rumors emerged over July that she would resume but President Joe Biden suggested on July 20 that US military officials opposed the trip, believed the timing to be inappropriate. Taiwan was not mentioned in Pelosi’s official itinerary published on July 31, which includes Singapore, Japan, South Korea, and Malaysia. But the Wall Street Journal report has been corroborated by US and Taiwanese officials. Assuming Pelosi goes, China will respond with some military show of force. The US may pretend that one hand (the White House, the Department of Defense) does not know what the other hand is doing (the House of Representatives). But China will not be convinced. There are three major reasons that we have predicted a fourth Taiwan Strait crisis: 1. China’s reversion to autocracy and foreign policy hawkishness: After the Great Recession, China was forced into a painful downshift in potential economic growth, stemming from a contracting labor force, excessive debt, and changes in the international economy (Chart 1). As economic growth has slowed, China has pursued political centralization, economic mercantilism, military modernization, and foreign policy assertiveness, offering nationalism as a distraction from the disappointments of the new middle class. While China may not be ready to launch a full-scale invasion of Taiwan, it is willing to do so if the Communist Party regime’s survival is at stake. Chart 1China's Slowdown Leads To Hawkishness
China's Slowdown Leads To Hawkishness
China's Slowdown Leads To Hawkishness
2. Taiwan’s reassertion of autonomy: Taiwanese people began to sour on mainland China with the Great Recession and increasingly developed an independent identity (Chart 2). China’s growing economic influence, combined with Xi Jinping’s re-centralization of power across Greater China, provoked a backlash in Taiwan beginning in 2013 that culminated in the nominally pro-independence Democratic Progressive Party gaining full control of the island in 2016. The US-China trade war, China’s imposition of control over critical buffer spaces (including the South China Sea and Hong Kong), and US export controls on advanced technologies thrust Taiwan into the middle of a strategic confrontation. While Taiwan is not seeking war or formal political independence, it is seeking closer ties with the US and democratic allies to protect against Beijing’s encroachment. 3. US political instability and foreign policy reaction: The Great Recession brought the US’s latent political instability from a simmer to a boil. The Washington establishment withdrew from the war on terrorism only to face discontent at home and strategic competition from China and Russia. China intensified its acquisition of US technology while North Korea obtained a nuclear arsenal under China’s watch. A surge in populism led the US to initiate a trade war against China and to impose restrictions on critical technologies to slow China’s modernization. While the US political factions bickered over domestic policy, they both tapped into a popular consensus on economic nationalism and hawkishness toward China (Chart 3). While the US is struggling to curb Russia and Iran, its greatest long-term challenge stems from China and it is increasingly focused on containing China’s economy and strategic ambitions. Chart 2Taiwanese Souring On China
The Fourth Taiwan Strait Crisis
The Fourth Taiwan Strait Crisis
Chart 3US Hawkish Consensus On China
The Fourth Taiwan Strait Crisis
The Fourth Taiwan Strait Crisis
In addition, there are important cyclical reasons why investors should take very seriously the risk of a major geopolitical crisis emanating from Taiwan in the short run: The Covid-19 pandemic intensified US (and global) distrust of China and accelerated the divorce of the US and Chinese economies. It also threw the Chinese economy into a downward spin, threatening Xi Jinping’s personal security and the Communist Party’s regime security. Hypo-globalization reduces critical economic constraints on military conflict. The Ukraine war highlighted the willingness of ambitious strongman regimes to go to war to prevent neighboring countries from allying with the United States. Taiwan is critical to Chinese security just as Ukraine is critical to Russian. Taiwan, like Ukraine, lacks a mutual defense treaty with the US and yet is attempting to create a de facto treaty through political, economic, and military cooperation – a scenario that will incentivize Chinese military action if it ever believes the US will take irrevocable steps to increase its commitment to defend Taiwan. At the same time, the US will try to deter China more effectively, since its deterrence failed in the case of Ukraine, which entails upgrading the Taiwanese relationship. Hence China will feel threatened and accuse the US of altering the status quo. Russo-Chinese alliance prevents US-China reengagement. Russia threw itself into China’s arms by cutting off natural gas to Europe. China cannot reject Russia’s overture because it needs Russia’s alliance to break through American strategic containment in the coming years. China needs Russia’s natural resources and its cooperation in gaining economic access to Central Asia and the Middle East. The US cannot pursue strategic détente with China if China is allying with Russia, since a Russo-Chinese alliance poses an unprecedented threat to American global influence and security (Chart 4). The Democratic Party is desperate to mitigate looming election losses. President Biden’s approval rating has fallen to 39%, while headline inflation hits 9% and the economy slips into a technical recession. The Republican Party is lined up for a victory in the midterm elections, yet Democrats view the populist Republicans as an existential threat. Hence Biden and Democratic leaders like Pelosi are willing to take significant risks to salvage the election, including provoking foreign rivals. The administration is contemplating tougher export controls on China’s access to semiconductor manufacturing equipment and Congress is passing bipartisan legislation to make the US more competitive against China. Any major confrontation abroad would generate a patriotic rally among voters, as did the Cuban Missile Crisis in 1962, which saved the Democrats from heavy losses in the midterms that year (Chart 5). China’s domestic politics support a foreign confrontation. As Xi attempts to cement another five-to-ten years in power at the twentieth national party congress this fall, the pandemic restrictions, political repression, property bust, and economic slowdown ensure that he has little good news to celebrate at home. He could benefit from taking an aggressive stance against the imperialist Americans over Taiwan – and he cannot afford to back down or lose face. Ultimately China’s regime legitimacy is at stake in Taiwan so it is willing to take greater risks than the United States. Chart 4US Cannot Engage With Russo-Chinese Behemoth
US Cannot Engage With Russo-Chinese Behemoth
US Cannot Engage With Russo-Chinese Behemoth
Chart 5Biden Can Take Risks Ahead Of Midterms
The Fourth Taiwan Strait Crisis
The Fourth Taiwan Strait Crisis
All of the above demonstrates that investors should not be complacent but should take risk off the table until the Pelosi trip blows over. A major diplomatic or geopolitical crisis will occur if Pelosi indeed visits Taiwan, for China will be required to react to uphold the credibility of its warnings, and Beijing will have a national and political interest in overreacting rather than underreacting. The Americans will then have a national and political interest in preserving their own credibility. This dynamic could lead to a major escalation in strategic tensions. Could a crisis lead to full-scale war? Yes it could but most likely it will not – at least not yet. Here are some important limitations, which investors should monitor closely. If these are reduced or overcome, then a larger conflict becomes more probable: Taiwan is harder to invade than Ukraine. Taiwan is an island and islands that are politically unified can only be subdued with enormous cost of blood and treasure even by the most powerful armies. Taiwan is critical to the global economy, unlike Ukraine. While it lacks defense treaties, it has stronger strategic partnerships than Ukraine did. The Chinese military has not fought an expeditionary war since Vietnam in 1979. The US sent aircraft carriers to the Taiwan Strait in each of the previous three crises since the 1950s, signaling that it is willing to defend Taiwan, and currently has at least two aircraft carriers in Asia Pacific (Map 1). China needs to be prepared for potential American and Japanese intervention if it is to attack Taiwan, which requires an advanced triad of nuclear arms. Map 1US Aircraft Carriers Suggest Taiwan Risk Is Substantial
The Fourth Taiwan Strait Crisis
The Fourth Taiwan Strait Crisis
The US is not sending any game-changing offensive weapon systems. Instead the US is sending a mere politician. China opposes anything resembling state-to-state relations but Taiwan’s defensive capability would not be improved. Hence China would not be forced to take aggressive military action. Instead China is attempting to set a very low bar for intervening in US-Taiwan political relations. Beijing can intervene in a way that enforces the new line but remains beneath the threshold of war. Going forward, US arms sales to Taiwan will be a much riskier affair and the delivery of a weapons system could trigger conflict (Chart 6). Chinese economy is not (yet) beyond help. China still has authoritarian powers to manipulate the domestic economy, suggesting that policy makers will intervene to slow down the property bust and stimulate activity. After Xi Jinping consolidates power, we expect a pro-growth strategy to be unveiled that will lead to a stabilization of growth in 2023. This is necessary for Xi to maintain domestic stability, which is existential to the regime and its long-term security. If stimulus and interventions fail utterly and China collapses into a full-blown financial crisis, then China will lose the ability to improve its security over the long run and the risk of conflict with foreign powers will rise. But as long as China’s economy is not collapsing, China maintains the prospect of building its influence and power over time and conquering Taiwan through absorption rather than extremely risky armed conflict (Chart 7). Chart 6US Arms Sales Could Trigger A Real Conflict
US Arms Sales Could Trigger A Real Conflict
US Arms Sales Could Trigger A Real Conflict
Chart 7More Economic Stimulus Is Coming
More Economic Stimulus Is Coming
More Economic Stimulus Is Coming
Taiwan is not moving toward formal independence. The Tsai Ing-wen administration is nominally in favor of independence but has chosen rhetorical sleight of hand over any formal change to Taiwan’s status. Taiwanese people support the status quo knowing that they will live in a war zone if they declare independence. The long-term problem stems from the fact that a clear majority opposes unification with the mainland (Chart 8). Taiwan and the US face elections in 2022 and 2024. If the Kuomintang stages a comeback in Taiwanese politics, or the Democrats win reelection in 2024, then China still has the ability to pursue its aims through diplomacy. Whereas if the Democratic Progressive Party remains in full control of Taiwan, and the Republicans regain the White House, Beijing may conclude that little can be gained through diplomacy. Especially if these US and Taiwanese parties proceed to press their interests aggressively. Chart 8Taiwanese Not Declaring Independence
The Fourth Taiwan Strait Crisis
The Fourth Taiwan Strait Crisis
Hence the most likely outcome if Pelosi visits Taiwan is a US-China geopolitical crisis of some sort but not a full-scale war. A crisis short of war could establish a new set of red lines over Taiwan that could govern the US-China relationship in the medium term with reduced uncertainty. But it would bring very bad news in the short run and lead to a permanent deterioration in US-China relations and global stability over the long run, which markets must price first. Bottom Line: Tactically investors should prefer government bonds to equities, US equities to global, defensive sectors to cyclicals, and safe havens to risky assets. Stay short Chinese and Taiwanese currencies and assets. While semiconductor stocks stand at risk, investors should favor US semiconductor companies over Chinese and Taiwanese (Chart 9). Chart 9Investors Should Seek Safe Havens
Investors Should Seek Safe Havens
Investors Should Seek Safe Havens
Matt Gertken Chief Geopolitical Strategist mattg@bcaresearch.com Strategic Themes Open Tactical Positions (0-6 Months) Open Cyclical Recommendations (6-18 Months) Regional Geopolitical Risk Matrix
Dear Client, On Monday August 8, I will be sending you an abbreviated version of our monthly Chart Pack. Our regular publication will resume on August 15. Kind regards, Irene Tunkel Executive Summary The US Is Vulnerable: Only 10% Of Chips Are Manufactured At Home
What To Do With Semiconductors And The Energy Sector
What To Do With Semiconductors And The Energy Sector
In the following report we continue answering questions from our “Bear Market 2.0” webcast, by reviewing recent US legislative actions, and their effects on semiconductor and energy stocks. Semiconductors Bill: Over the long term, the recently passed CHIPS+ bill will have a moderately positive effect on the supply of chips and will benefit a select group of companies with chip manufacturing capabilities. Semiconductors Overview: Semis are "growthy" and have surged on the back of falling yields. They are also highly cyclical, and slowing growth will become a headwind to performance. Demand for chips is fading, especially in the consumer electronics space, with sales slowing and inventories building up. We prefer more stable growth areas of the Technology sector and are overweight Software and Services as opposed to semis stocks. The bill is not enough to "move the needle". What To Do With Energy? The stars are aligning for the price of energy to turn down decisively – not only is demand for energy flagging on the back of slowing economic growth, but also the Inflation Act will likely further boost energy production. As a result, we downgrade the Exploration & Production segment, maintain our overweight in the Equipment & Services, and boost Storage & Transportation from underweight to neutral on the back of the upcoming new pipeline construction. Bottom Line: We remain underweight semis as the one-off boost from the CHIPS+ bill does not counterbalance demand headwinds. When it comes to Energy, the capex upswing will lower the price of oil which warrants an underweight stance in Exploration & Production names. Feature This week investors experienced a deluge of news and data, spanning the Fed rate decision, the Q2-2022 GDP estimate, and earnings reports from some of the largest US corporations, such as Apple, Amazon, and Facebook. To top it off, we had major developments on the legislation front after a multi-month hiatus. Two major bills, the Chips and Science Act of 2022 (aka CHIPS+) and the Inflation Reduction Act of 2022 (an incarnation of Build Back Better), are close to passage, after months and months of dithering. In this report, we will discuss the potential effects of these pieces of legislation on the two equity sectors most affected, Semiconductors and Energy. Since these sectors are also at the epicenter of recent market action, we hope that this report is timely and will help you make the right investment decisions. Sneak Preview: We maintain our underweight on Semiconductors, and downgrade Energy Exploration and Production to an underweight on the back of falling energy prices. Semiconductors: Is It Time To Close The Underweight? When it comes to semis stocks, the current bear market caused a deeper peak-to-trough correction (40%) than at the bottom of the pandemic, implying that, perhaps, much of the bad news was priced in. We have been underweight semis since early January and are up 14% relative to the S&P 500. With the industry bouncing 20% off its June lows, we question whether we have overstayed our welcome and it is time to close this underweight, especially in light of the imminent passage of the CHIPS+ bill. Let’s start by discussing the bill: Designed In The US, Made In Asia In a November 2021 “Semiconductors: Aren’t They Fab?!” Special Report, we highlighted that semiconductor production is divided among chip designers and manufacturers, a so-called “fabless model,” which has grown in prominence as the pace of innovation made it increasingly difficult for firms to manage both the capital intensity of manufacturing and the high levels of R&D spending for design. The entire semiconductor industry depends on cooperation between two regions: North America, which houses global leaders in designing the most sophisticated chips, and Asia, which is home to companies that have the technology to manufacture them (Charts 1 & 2). As a result, the US share of chip manufacturing has been falling steadily for the past 30 years, from 37% to 10% (Chart 3). Recent, supply chain disruptions and heightening geopolitical tensions have underscored this country’s vulnerability due to outsourcing of chip manufacturing, which led to renewed calls for chip independence and onshoring. Chart 1Chips Are Designed In The US...
What To Do With Semiconductors And The Energy Sector
What To Do With Semiconductors And The Energy Sector
Chart 2...And Manufactured In Asia
What To Do With Semiconductors And The Energy Sector
What To Do With Semiconductors And The Energy Sector
Objective Of The CHIPS+ Bill Congress has passed the CHIPS+ bill to alleviate the chip shortage and shore up US competitiveness with China. Money is earmarked for domestic semiconductor production and research, and factory construction. The bill will provide financial incentives for both US and non-US chip makers to open manufacturing plants in the US while restricting semiconductor companies’ activities “in specific countries that present a national security threat to the United States.” The provision ensures that China, which has also been recently striving for chip independence, will not be a beneficiary of US government funds. The bill also comes with strings attached: It states that it will not allow companies to use any of the funds to buy back stocks or issue dividends. Chart 3The US Is Vulnerable: Only 10% Of Chips Are Manufactured At Home
What To Do With Semiconductors And The Energy Sector
What To Do With Semiconductors And The Energy Sector
Cost Of The Bill Preliminary analysis from the Congressional Budget Office assesses that the bill will trigger roughly $79 billion in new spending over the coming decade. The key provision in the bill is the $52.7 billion for chip makers. Of those funds, $39 billion is earmarked to “build, expand, or modernize domestic facilities” for chip-making, while $11 billion is set aside for research and development. Funds will be spread over five years. The bill also adds $24 billion in tax incentives and other provisions for semiconductor manufacturing. In addition, $2 billion is allocated to translate laboratory advances into military and other applications. While $79 billion sounds like a lot of money, we need to keep things in perspective. As Barron’s pointed out: “According to IC Insights, total semiconductor industry capital spending is estimated to grow 24% this year, to $190 billion. Assuming some growth over the next several years, the bill would be a modest single digit percentage of the aggregate spending over the five-year time period.” Therefore, the financial benefits the bill provides are modest. Key Beneficiaries US chip makers with fab facilities, such as Intel (INTC), Micron Technology (MU), and Texas Instruments (TXN) will be the key beneficiaries of the bill as they are offered financial incentives for opening new plants. Foreign companies, such as TSMC, Samsung, and Global Foundries, might also qualify for financial incentives to open chip production facilities in the US. In fact, Intel, TSMC, and Global Foundries have already announced plans to build plants in the US contingent on the bill’s passing. Fabless chip designers, such as Nvidia (NVDA), AMD, and Qualcomm are unlikely to benefit from the package in a major way. Over the long term, the bill will have a moderately positive effect on the supply of chips and will benefit a select group of companies with chip manufacturing capabilities. Demand For Chips Is Fading While the bill will have some positive effect on chip manufacturing, there is a lurking danger that production is being ramped up globally just at a time when, after prolonged shortages, demand for chips is starting to fade. Historically, this highly cyclical industry has gone through boom and boost cycles every three to four years. During the Q2 earnings call, TSMC Chief Executive Mr. Wei said that the broader industry is dealing with an “inventory correction” that has led customers to cut orders from some of its peers. After two years of pandemic-driven demand, “our expectation is for the excess inventory in the semiconductor supply chain to take a few quarters to rebalance to a healthier level.” This is not surprising. Semiconductors are highly economically sensitive with sales declining in lockstep with slowing global growth (Chart 4), while inventory levels are picking up (Chart 5). Chart 4Sales Are Declining In Lockstep With Slowing Global Growth
Sales Are Declining In Lockstep With Slowing Global Growth
Sales Are Declining In Lockstep With Slowing Global Growth
Chart 5Chip Inventory Levels Are Picking Up
Chip Inventory Levels Are Picking Up
Chip Inventory Levels Are Picking Up
Demand for two of the industry’s key markets, computers and mobile phones, which account for 50% of the overall chip demand, seems to be deteriorating rapidly amid the slowing global economy. Demand for consumer electronics is fading after a pandemic surge of buying, when consumers pulled forward their spending on phones and computers. Most of these items don’t need to be upgraded or replaced for years. COVID-related lockdowns in China, meanwhile, have also weighed on consumer demand. According to IDC, worldwide shipments of personal computers fell 15% in the June quarter from a year earlier, due to “macroeconomic headwinds.” IDC has also lowered its forecast for 2022 expecting computer shipments to retreat by 8.2%. Canalys said global shipments for mobile phones fell 9% year over year, following economic headwinds, sluggish demand, and inventory pile-up. Memory chips represent 28% of the industry, and DRAM accounts represent three-fifths of memory sales. DRAM prices are falling (Chart 6). According to TrendForce, the average contract price for a DRAM, used widely in consumer items ranging from cars to phones to fridges, fell by 10.6% during the second quarter, compared to a year ago, the first such decline in two years. DRAM prices are expected to slide by 21% in Q3-2022. Companies are telling us similar stories: Micron, the No. 3 player in memory, recently issued revenue guidance well below analysts’ estimates. Chief Executive Sanjay Mehrotra warned that “the industry demand environment has weakened,” with PC and smartphone sales declining. Lisa Su, Chief Executive of AMD, expects computer demand to be roughly flat. Nvidia is bracing for a slowdown in the crypto space and game consoles. Intel has reported disappointing results: PC customers are reducing inventory levels at a rate not seen in a decade, Chief Executive Pat Gelsinger said in a call with analysts. PC makers typically reduce inventory levels of chips when they are expecting lower sales. Chart 6DRAM Prices Are Falling
DRAM Prices Are Falling
DRAM Prices Are Falling
Of course, there is significant variability in demand for chips across sectors: While demand for phones and computers is fading, there is still pent-up demand for auto chips, and servers (Chart 7). According to Ms. Su, demand remains hot for chips used in high-performance computers and servers. TSMC, which has Apple and Nvidia among its clients, seconds this notion: Quarterly revenue for high-performance computers, increased 13% from the previous quarter and was greater than the revenue from smartphones, which rose 3%. There are also significant shortages of less-advanced auto chips (Chart 8). In a recent Q2 earnings call, GM reported that it carries 95,000 unfinished cars in its inventory due to the auto chip shortage. According to Mr. Wei of TSMC, the company will continue investing in auto chips, a product that historically it didn’t emphasize as much as its cutting-edge chips, in response to strong demand. Texas Instruments, which reported stellar results, also said that while it saw strength in the auto and industrial segments, demand from the consumer electronics market remained weak in both the second quarter and the current quarter. Chart 7Demand For Servers Is Still Strong
Demand For Servers Is Still Strong
Demand For Servers Is Still Strong
Chart 8More Chips Will Boost Auto Sales
More Chips Will Boost Auto Sales
More Chips Will Boost Auto Sales
Demand for chips is fading, especially in the consumer electronics space, with sales slowing and inventories building up. Pricing power is also fading. However, there are still areas immune to the downturn, such as chips for servers, high-performance computers, and less advanced auto chips. Valuations and Fundamentals Earnings growth expectations have also come down significantly off their peak, and are currently at 5% for the next 12 months, which indicates negative real growth (Chart 9). Chart 9Earnings Growth Is Slowing
Earnings Growth Is Slowing
Earnings Growth Is Slowing
Chart 10Valuations Are Above Pre-Pandemic Trough
Valuations Are Above Pre-Pandemic Trough
Valuations Are Above Pre-Pandemic Trough
Semi valuations have pulled back from a 33x trailing multiple to 17x over the course of six months, only to bounce back another 3x since June 16, currently trading at 20x multiple. While valuations certainly moderated, they are still above the pre-pandemic trough in 2019 when the global economy was also slowing. The BCA Valuation Indicator, an amalgamation of various valuation metrics, indicates that semiconductors trade at fair value (Chart 10 & Chart 11). The rebound rally was fast and furious; at nearly 20% off market lows, it feels like much of the recovery from severely oversold conditions has run its course. Chart 11Chips Are Moderately Priced, While Investor Position Is Light
Chips Are Moderately Priced, While Investor Position Is Light
Chips Are Moderately Priced, While Investor Position Is Light
Semis Investment Implications Semiconductors are somewhat unique in that they are both cyclical and “growthy” (Chart 12). Since semis are “growthy,” the past six-week rebound may be attributed to falling rates, which have led to multiple expansion of most growth sectors. However, we need to keep in mind that rates have stabilized because of signs of global slowdown, and that the cyclical nature of semis will get in the way of further outperformance. While we also believe that the CHIPS+ bill is a modest tailwind, it is hard to commit to an industry in the early innings of contraction. For investors who would like to top up their allocations to semis, we recommend companies most exposed to demand from industrial sectors (autos, servers, high performance computers), and staying away from companies most exposed to consumer electronics. Much of the performance of companies that have reported so far hinged on their product mix. Chart 12Semis Are Both "Growthy" And Cyclical
Semis Are Both "Growthy" And Cyclical
Semis Are Both "Growthy" And Cyclical
Bottom Line We are reluctant to add to semis after the sector gained nearly 20% in just six weeks. Economic challenges remain – demand for chips is slowing, and the process of clearing inventory build-up may take several quarters. CHIPS+ is a positive but, in our opinion, is not enough to move the needle. We prefer more stable growth areas of the Technology sector and are overweight Software and Services. We also prefer semis most exposed to demand from non-consumer sectors. What To Do With Energy? We are currently equal-weight Energy. More specifically, we are overweight Energy Equipment and Services, equal weight Explorations and Production (we closed an overweight in March, booking a profit of 50%), and underweight Energy Transportation industry groups. With Brent down 18% and GSCI down 15%, and economic growth slowing, it is essential to review what is in store for the sector. Further, the Inflation Reduction Act, which is now on President Biden desk expecting his signature, has quite a few provisions relevant to the sector. Inflation Reduction Act And Its Effects On The Fossil Fuels Industry This bill is a true marvel of political negotiation and gives all parties something to be happy about and something to complain about. While the bill earmarks $370 billion for clean energy spending at the insistence of Senator Manchin (D, WV), the legislative package provides support for traditional sources of energy like oil, gas, and coal. Broadly speaking, the bill is a positive for expanding domestic energy production and supporting its nascent Capex cycle, which we called for in the “Energy: After Seven Lean Years” Special Report. Development of new wells has already picked up over the past few months (Chart 13). Chart 13New Energy CAPEX Cycle
New Energy CAPEX Cycle
New Energy CAPEX Cycle
Here are a few important rules stipulated by the bill, highlighted by the Wall Street Journal: Expanding offshore wind and solar power development on federal land will now require the federal government to offer more access for drilling on federal territory. Under the bill, the Interior Department would be required to offer up at least two million acres of federal land and 60 million acres of offshore acreage to oil and gas producers every year for the next decade. It would be the first-ever required minimum acreage for offshore oil and gas leasing and would significantly increase the acreage requirements for onshore leasing. The bill would also effectively reinstate an 80-million-acre sale of the Gulf of Mexico to the oil drillers last year that a federal judge had invalidated. The bill is also a major positive for the natural gas industry, providing an accelerated timeline for building the pipelines and terminals needed to increase production and export of fossil fuels. In exchange for access to more federal territory, oil and gas companies would also have to pay higher royalty rates for drilling there. It would also require them to pay royalties on methane they burn off or let intentionally escape from their operations on federal lands. The bill aims to increase the supply of oil, gas, and coal, and return the US towards energy independence. Over the medium term, it should lead to a normalization of the price of energy. Demand Vs. Supply Naturally, the price of oil is all about supply and demand. And the performance of the energy sector is inextricably linked to the price of oil (Chart 14). Supply: According to our EM Strategist, Arthur Budaghyan, “fears that sanctions on Russia will considerably reduce global oil supply have not yet materialized.” According to International Energy Agency (IEA) estimates, Russia’s shipments of crude and oil products have declined by only about 5% since January (Chart 15). Clearly, despite the sanctions and logistical challenges that Western governments have enforced on Russia, the country’s oil exports have not collapsed. Chart 14Price Of Oil Is Important For The Energy Sector's Profitability
Price Of Oil Is Important For The Energy Sector's Profitability
Price Of Oil Is Important For The Energy Sector's Profitability
Chart 15Russia's Supply Of Oil Has Decreased By Only 5%
Russia's Supply Of Oil Has Decreased By Only 5%
Russia's Supply Of Oil Has Decreased By Only 5%
Demand: Meanwhile, global commodities and energy demand is downshifting in response to both high fuel prices and weakening global growth. US consumption of gasoline and other motor fuel has marginally contracted (Chart 16, top panel). In China, rolling lockdowns and weak income growth will continue to suppress the nation’s crude oil imports, which have already been depressed over the past 12 months (Chart 16, bottom panel). In the rest of EM (excluding China), a strong dollar and high oil prices are leading to demand destruction. Chart 16US And Chinese Oil Consumption Is Weak
US And Chinese Oil Consumption Is Weak
US And Chinese Oil Consumption Is Weak
Prices Are To Trend Down: Hence, the supply of energy and commodities is stable, but demand is flagging, which does not bode well for the prices of energy and materials. Odds are that oil prices will decline further and recouple with industrial and precious metal prices. In addition, as the market anticipates a turn in inflation, there is a pronounced rotation away from Energy and Materials towards Technology and other growth pockets of the market (Charts 17 & 18). With a supply of energy staying steady or even expanding, while demand is slowing on the back of the global slowdown, we expect the price of energy to trend down. Chart 17Energy And Materials Were Biggest Winners In the "Inflation High And Rising" Regime...
What To Do With Semiconductors And The Energy Sector
What To Do With Semiconductors And The Energy Sector
Chart 18...But They Gave Back Their Gains In "Inflation High But Falling" Regime
What To Do With Semiconductors And The Energy Sector
What To Do With Semiconductors And The Energy Sector
Energy Investment Implications It appears that the stars are aligning for the price of energy to turn down decisively – not only is demand for energy flagging on the back of slowing economic growth, but also the Inflation Act will likely further boost energy production. As production is expanded and prices fall, the profitability of the Oil Exploration and Production industry (upstream) will decline. In addition, inflation is about to turn, and a change in market leadership has already ensued. We downgrade Exploration and Production to an underweight. In the meantime, the Equipment and Services industry will benefit from contracts to develop new wells and will thrive. We maintain an overweight. We are currently underweight the Energy Storage and Transportation industry (mid-stream) as historically, this industry was marred in multiple regulations and most expansion projects faced obstacles, especially if running through public land. However, under the provisions of the Inflation Act, midstream will benefit from rising production volumes and expedited construction the pipelines and terminals needed to increase production and exports of fossil fuels. We upgrade Storage and Transportation to an equal weight. Bottom Line The Inflation Reduction Act will create conditions favorable for expanding the production of fossil fuels and will support US energy independence. As supply grows while demand is slowing, the price of energy is likely to turn – while a boon for US consumers, this is a headwind to the performance of the Energy sector. Irene Tunkel Chief Strategist, US Equity Strategy irene.tunkel@bcaresearch.com Recommended Allocation
Executive Summary Reporters at last week’s post-FOMC press conference were consumed by the prospect of a recession. Their questions about the economy echoed the analysts’ on bank earnings calls and Chair Powell’s answers echoed the CEOs’ and the CFOs’: while it has clearly slowed, it remains stronger than it would be in a recession. Although the Econ 101 definition of a recession – two or more quarters of contracting real GDP – is embedded in the public’s mind, the NBER’s recession criteria are more involved and do not appear as if they have yet been met. With a little over half of index constituents (~70% of market cap) having reported, S&P 500 earnings have surprised to the upside. Despite a rampaging dollar and a sharp backup in corporate bond yields, margins are down less than 60 basis points from 2Q21 and are unchanged from 1Q22. We are constructive on equities and credit over a three-to-twelve-month timeframe because we believe markets have priced in the impact of the next recession too soon. We expect the Fed will eventually induce a recession, but not for at least another year. Earnings Haven't Stumbled Yet
Earnings Have Not Stumbled Yet
Earnings Have Not Stumbled Yet
Bottom Line: Continue to overweight equities in multi-asset portfolios with a twelve-month timeframe because markets have gotten ahead of themselves by selling off so sharply. A recession will not arrive before underweight investors judged on their relative quarterly performance are forced back into stocks. Feature And we thought investors were preoccupied with recession. The questions sell-side analysts asked on big bank earnings calls in mid-July revealed that the shadow of a recession loomed large in their institutional investor clients’ minds. The questions markets and economics reporters asked Chair Powell at his post-FOMC meeting press conference last week demonstrated that the media is positively obsessed with it. If it bleeds, it leads is no longer just the local TV newscast’s mantra. We have been trying to steer the discussion away from are-we-or-aren’t-we toward questions that we think are more productive for investors. How bad will the next downturn be? What is its current estimated time of arrival? Have markets under or overreacted to our best guess about severity and ETA, assuming the marginal price setter has a timeframe of twelve months or less? Are-we-or-aren’t-we is manifestly Topic A in the financial and general media, however, so the body of this week’s report is given over to why we think we are neither in a recession nor on the cusp of one. We will turn to financial markets and investment strategy in the concluding section. What Is A Recession? In Econ 101 three-plus decades ago, I learned that a recession was defined as back-to-back quarters of economic contraction as measured by real GDP. For all the time that has passed since, I remember that definition clearly. Apparently other graduates do, too, and the definition taught in central Virginia was the standard in Economics departments across the nation. Alas, life is more complicated than it seemed in those halcyon student days. Business cycle inflections are not always apparent to the naked eye and the NBER’s Business Cycle Dating Committee has been tasked with assessing when downturns are sufficiently deep, diffuse and persistent to constitute a recession. The committee monitors a broad range of indicators and moves deliberately, announcing its determinations only after enough subsequent data have arrived to support its assessment of peaks and troughs. For the six recessions since 1980, the committee has announced cycle peaks with an average lag of seven months and cycle troughs with an average lag of fifteen months (Table 1). Table 1Long And Variable Lags
Recession Obsession
Recession Obsession
Equity and credit portfolio managers and analysts spend a lot more time on corporate earnings than GDP, so the recession debate would seem to be of interest mainly within the ivory towers of academia, think tanks and the bureaucracy. The topic is relevant for investors, however, because equity bear markets tend to coincide with recessions. As bear markets (Chart 1, light red shading) typically begin before NBER-designated recessions (gray shading) and always end before them, it is worth investors’ time to try to anticipate their onset. Since a significant portion of bear market drawdowns occur after the recession is deemed to have started, there is also value in the humbler (and more attainable) aim of recognizing a recession once it’s begun. Chart 1Bear Markets And Recessions Tend To Travel Together
Bear Markets And Recessions Tend To Travel Together
Bear Markets And Recessions Tend To Travel Together
So Has It Begun? At the risk of sounding like Jay Powell before a skeptical pool of reporters, we do not think the economy is in a recession, primarily because the labor market is so strong. Recessions always follow one-third percentage-point increases in the three-month moving average of the unemployment rate, but it has yet to begin moving upward (Chart 2). Leading indicators like small business hiring intentions (Chart 3, second panel), temporary employment (Chart 3, third panel) and initial jobless claims (Chart 3, bottom panel) point to continued payroll expansion (Chart 3, top panel). The economy is unquestionably slowing, and labor demand will slow with it, but the record backlog of job openings (Chart 4, top panel) and unabated stream of job quits (Chart 4, bottom panel) suggest that the labor market has a sizable cushion that will allow it to endure a few blows. Chart 2Unemployment Has Not Turned Yet
Unemployment Has Not Turned Yet
Unemployment Has Not Turned Yet
Chart 3The Employment Outlook Is Still Good ...
The Employment Outlook Is Still Good ...
The Employment Outlook Is Still Good ...
Chart 4... As There Is Still A Shortage Of Workers
... As There Is Still A Shortage Of Workers
... As There Is Still A Shortage Of Workers
Like Chair Powell, we would venture that the labor market’s cushion extends to the overall economy. We believe that households’ excess pandemic savings will buffer the largest component of aggregate demand from inflation pressures, though the eventual fate of those savings is hotly debated within BCA. Related Report US Investment StrategyA Difference Of Opinion We expect that a meaningful share of the $2 trillion-plus that households have amassed will eventually be spent; our Counterpoint team does not. The matter is not yet settled, but we are encouraged that the savings rate dipped below its February 2020 level of 8.3% in the fourth quarter and has been less than 6% every month this year, reaching a low of 5.1% in June. If the savings rate is mean-reverting, and if households don’t circle the wagons en masse as they might if recession prophecies become self-fulfilling, households have quite a bit of catching up to do (Chart 5). If consumption continues to lead business investment in line with the empirical record, fixed investment should be able to keep its head above water. Even a downshift in consumption and investment ought to be enough to offset the modest fiscal drag that may ensue if gridlock becomes even more constraining after November’s elections, as our US Political Strategy colleagues expect, and keep the expansion going for a few more quarters. Chart 5These Squirrels Have Stored Up A Lot Of Nuts For The Winter
These Squirrels Have Stored Up A Lot Of Nuts For The Winter
These Squirrels Have Stored Up A Lot Of Nuts For The Winter
Okay, But What About Earnings? S&P 500 earnings are where the rubber meets the road for investors. Befitting the one-step-forward, one-step-back course the macro data releases have followed, second quarter earnings have been mixed.1 In the aggregate, however, they’ve been solid, with the 56% of index constituents (~70% of market cap) that have reported so far beating earnings expectations by 5.2%. That’s in line with the typical underpromise-and-overdeliver earnings season theater but feels like a reprieve for investors who’ve been subjected to a steady drumbeat of recession talk. Profit margins have narrowed – earnings per share have grown 7.7% year over year, well shy of revenue per share’s 12.1% growth – but by less than expected, as the 5.2% earnings surprise has swamped the 1.6% revenue surprise. S&P 500 operating profit margins observed a tight range after the crisis before jumping by more than a percentage point when the top marginal corporate tax rate was lowered beginning in 2018 (Chart 6). They then made another percentage-point leap in 2021, as companies seemed to find another efficiency gear as they adjusted to the pandemic. The reasons for the pandemic leap aren’t clear – shrinking office footprints, lower utility bills and reduced travel and entertainment don’t seem like candidates to move the needle so far on their own – but according to Refinitiv, the owner of I/B/E/S, the definitive source for earnings estimates, it has persisted through the first two quarters of 2022.2 The contraction in real compensation since 2021 (Chart 7, second panel) has likely been the primary driver, but the backup in corporate bond yields (Chart 7, third panel) and the surging dollar (Chart 7, bottom panel) have been margin headwinds so far this year. Chart 6Profit Margins Remain Elevated
Profit Margins Remain Elevated
Profit Margins Remain Elevated
Chart 7Falling Real Wages Have Been Great For Margins
Falling Real Wages Have Been Great For Margins
Falling Real Wages Have Been Great For Margins
We expect that the interest expense and currency translation headwinds will largely disappear in the second half, leaving real wages as the critical swing factor. Our benign take on wages (from employers’ perspective) is not unanimously held within BCA and could be a crucial determinant of our more bullish recommendations’ outcome. Our view is predicated on an analysis of US labor relations history positing that employers have achieved formidable structural advantages over employees that cannot be unwound by a few years of a cyclical boost and one term of the determinedly labor-friendly Biden administration. Our interpretation runs counter to the prevailing view but we believe it is well supported and can provide a lengthy source bibliography for those inclined to check our work. Investment Implications There are no absolutes in financial markets. No asset is good or bad in itself; its merit is solely a function of its relative probability-adjusted risk-reward profile. The recession debate doesn’t matter much in itself; the key is whether this year’s market declines have gone too far in pricing in the severity, breadth, duration and proximity of the next downturn. We add proximity to the list of the NBER’s criteria because it is a critically important factor when most professional money managers, who exert outsize influence in setting prices, are judged on their relative quarterly and annual performance. We are not perma-bulls or attention-seekers. We are more bullish than our colleagues and the investor consensus purely because we think the equity market has gone too far in discounting the impact of a recession that we estimate will not begin before the second half of 2023 and may not be particularly deep in the absence of imbalances that make the real economy vulnerable to a metastasizing downturn. Inflation pressures have not been building unopposed across four presidencies (LBJ through Carter) while corporate management teams nearly indifferent to shareholder interests rolled over at the feet of the UAW and other formerly potent labor unions, entrenching the wage-price spiral. The Powell Fed has begun to hike the funds rate aggressively, but it will not have to smother the economy like the Volcker Fed to round up a fugitive inflation genie and force it back into the bottle. Chart 8It Is Not A Spiral When Prices Rout Wages
It Is Not A Spiral When Prices Rout Wages
It Is Not A Spiral When Prices Rout Wages
Levered capital has not been cascading into commercial real estate for better than a decade to exploit tax loopholes which were closed by the 1986 Tax Act, leaving savings and loans holding the bag and imperiling a sizable swath of the banking system. Stocks are expensive and there are plenty of pockets of silliness, but financial markets have not replayed the dot-com mania, no matter how promiscuously the term "bubble" is applied or how thoroughly the post-crisis rise in asset values has driven Austrian School devotees up the wall. Malinvestment has not occurred on anything close to the scale of the subprime crisis, when lenders, ratings agencies, regulators, banks and investors collectively failed at their duties, spawning a global crisis. American households have modest debt loads and a mountain of savings. Nonfinancial corporations are well heeled after a frenzy of pandemic debt issuance at laughably favorable terms. The banking system is doubly and triply reinforced with the biggest banks hemmed in by excessive capital requirements and stifling risk limits. The economy is likely to be on a better footing at the start of the next recession than it has been in any of the recessions of the previous 40 years (ex-the flash COVID recession). Although he wouldn’t answer the question directly, we thought Chair Powell made it abundantly clear that the Fed is willing to induce a recession if that’s what it takes to bring inflation to heel. We ultimately think the Fed will have to squash the economy to get inflation back down to its 2% target, but we don’t think it will happen over the timeframe that matters to the institutional investor constituencies that have a huge say in setting marginal prices. That view is at risk if inflation does not show signs of peaking soon or if longer-run inflation expectations rise to uncomfortable levels. For now, neither has happened and the latest run of data did not break one way or the other. Final July long-run inflation expectations of 2.9% from the University of Michigan consumer sentiment survey were down from June’s final 3.1% reading and meaningfully below the 3.3% preliminary June false alarm that jarred the FOMC. The second quarter employment cost index grew by more than 1% for the fourth straight quarter, extending its nominal rise (Chart 8, top panel) even while it continues to contract in real terms (Chart 8, bottom panel). A growth shortfall is a threat as well, though it failed to materialize in second quarter earnings, forcing the S&P 500 to unwind some of the weak growth expectations it had already discounted. If our base-case scenario holds, more such unwinding is in store. Doug Peta, CFA Chief US Investment Strategist dougp@bcaresearch.com Footnotes 1 As we worked on this report after Thursday’s market close, Amazon delighted investors, Apple pleased them and Intel, as per a barrons.com headline, “missed by a mile.” 2 Per Standard & Poor’s, the index’s operating margin fell by a percentage point in the first quarter. Though S&P has tended to define operating earnings less favorably than Refinitiv/I/B/E/S, the two series moved together directionally until 1Q22 and only Refinitiv’s data facilitates comparisons between past results and future expectations.
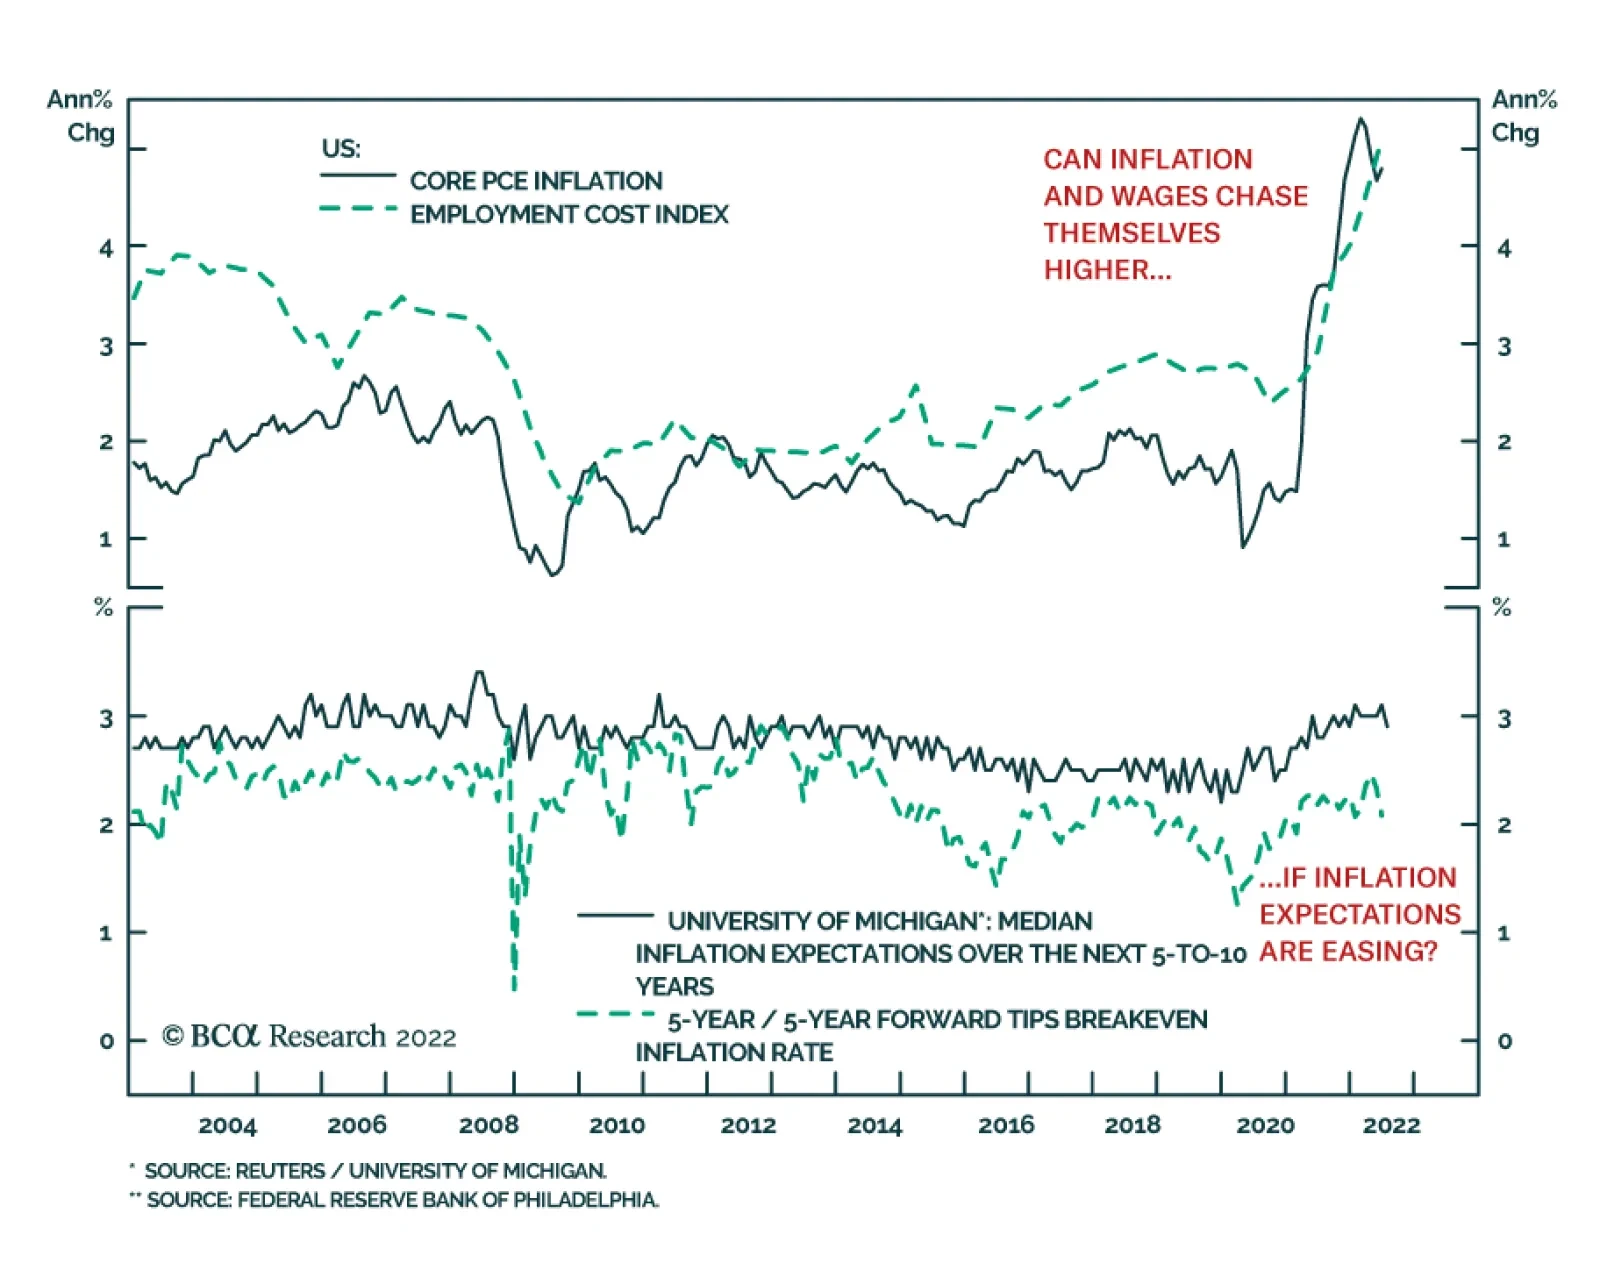
Both the employment cost index (ECI) and the PCE deflator beat expectations on Friday and came in on the strong side. The ECI accelerated to 5.1% y/y in Q2 from 4.5% y/y in Q1. The core PCE deflator, the Fed’s favored inflation gauge, rose from 4.7% to 4.8%…
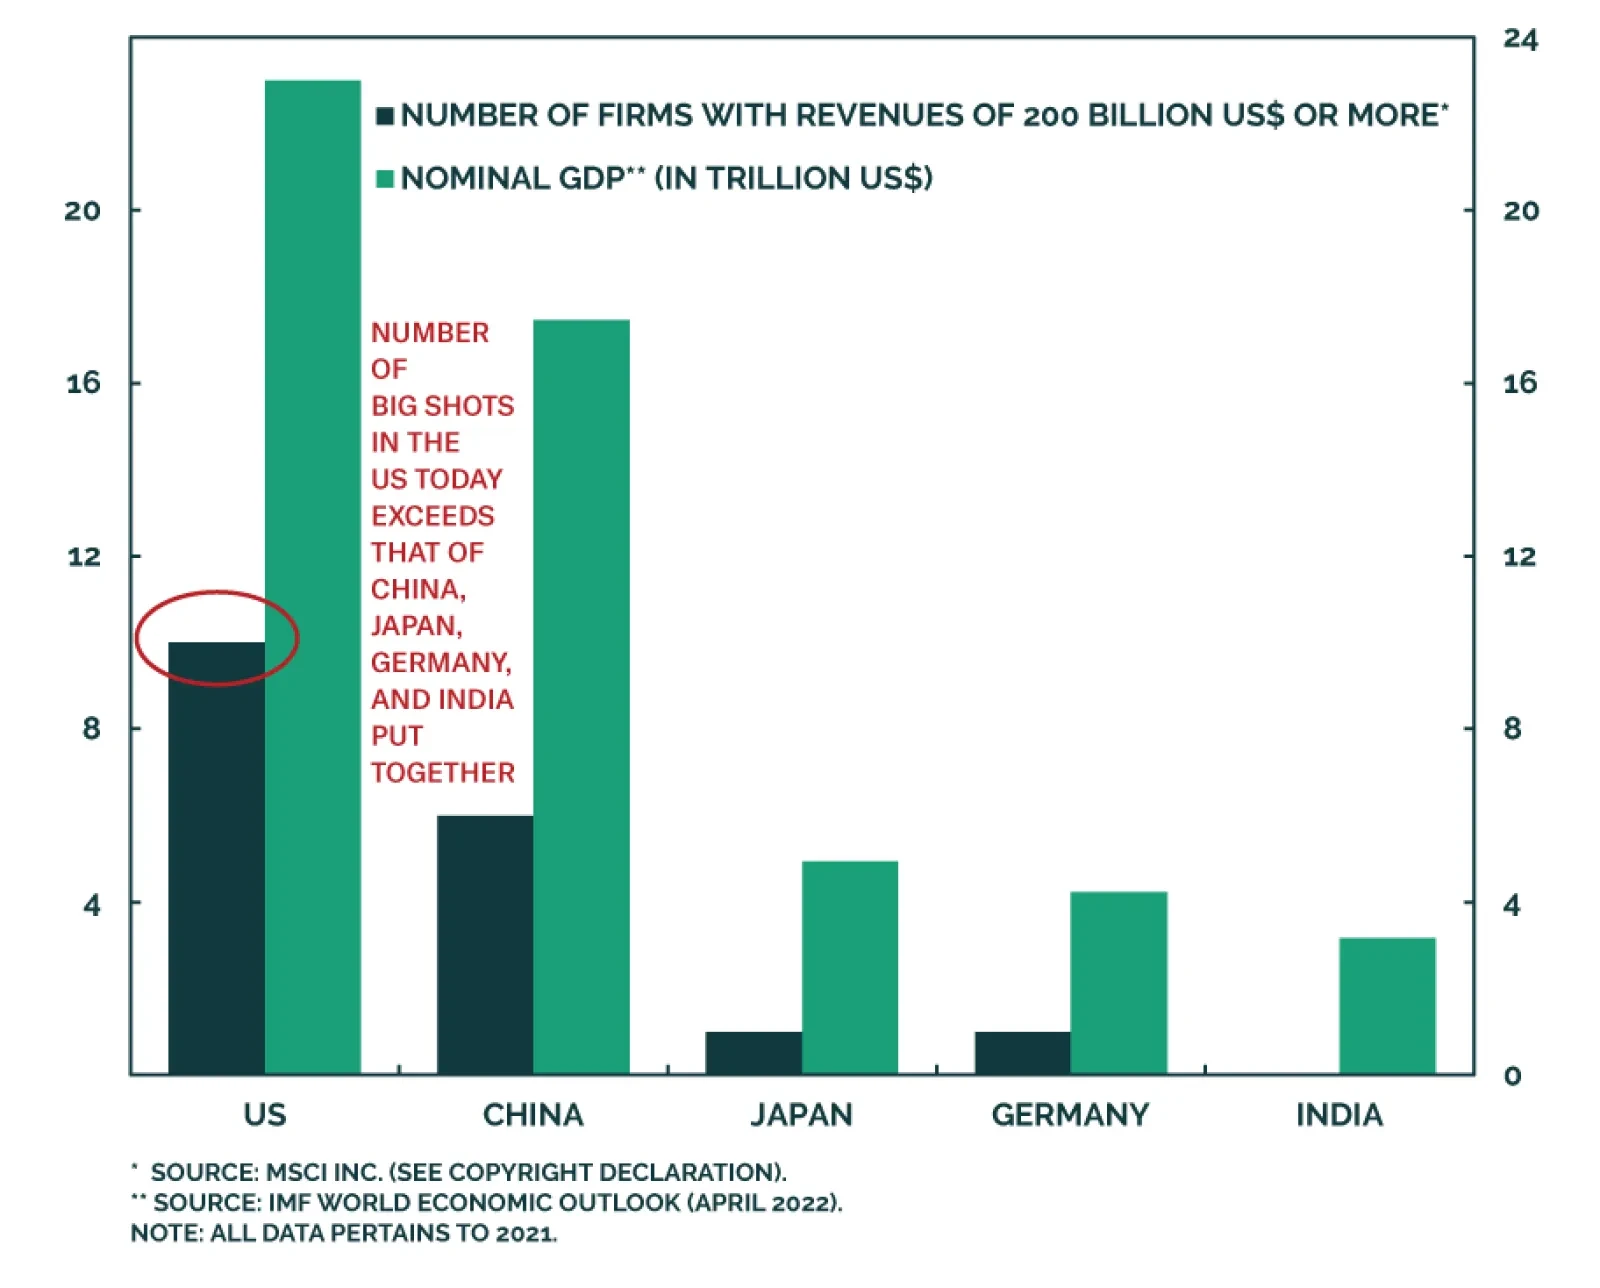
According to BCA Research’s Global Investment Strategy service, the high market share commanded by big American firms could end up being a liability. This dominance could bait regulatory attention, thereby affecting these firms’ growth prospects. The…
Feature Clean energy names rallied yesterday on the back of the news that a reconciliation deal was struck to support Biden’s fiscal package. The deal, which was dubbed the “Inflation Reduction Act Of 2022”, includes approximately $370 billion in clean energy spending as well as EV tax credits for both new and used cars. The bill has been sent to President Biden for his signature. The bill is a boon to two of our long-term investment themes: “EV Revolution” and “Is It Time To Invest Green And Clean?”. In both reports, we argued that both themes were to benefit from the favorable legislative tailwinds thanks to this administration’s focus on climate change prevention policies. Since its inception in June 2021, the EV theme has outperformed the S&P 500 by 15%, while the “Green and Clean” theme is up 14% since the April 2022 inauguration report. When it comes to investing in green technology and EV, we recommend investors continue to treat them as long-term thematic calls. Technological innovation themes are intrinsically risky: They are rarely immediately profitable and require both continuous investment and technological breakthroughs to succeed. As such, they are fickle over short term but pay off over a longer investment horizon. On a tactical basis both EV and clean energy stocks may be ripe for a pullback after a robust rally (Chart 2). Chart 1
On The Clean Energy Deal
On The Clean Energy Deal
Chart 2
On The Clean Energy Deal
On The Clean Energy Deal
Thematic themes are best captured either via an ETF or a custom basket. Green energy ETFs are TAN, FAN, RNRG, CTEC, RAYS, and WNDY. Electric vehicle ETFs are ARKQ, IDRIV, DRIV, and KARS (See appendix for details). Bottom Line: We reiterate our structural preference for green technology and EV stocks on the back of strong legislative support and a continuous push for innovation and affordability. Appendix Table 1
On The Clean Energy Deal
On The Clean Energy Deal
Table 2
On The Clean Energy Deal
On The Clean Energy Deal
Listen to a short summary of this report. Executive Summary The Dollar Rises During Recessions
How Deep A Recession Is The Dollar Pricing In?
How Deep A Recession Is The Dollar Pricing In?
At 106.5, the dollar DXY index is certainly pricing in a recession deeper than during the Covid-19 crisis. The dollar tends to rise during recessions and only peaks when a global economic recovery is in sight (Feature Chart). One caveat: contrary to conventional wisdom, US economic data is deteriorating relative to the rest of the world. Historically, that has been a negative for the greenback. The key question facing investors is if markets are entering a riot point. That is a high probability. Historically, high volatility supports the dollar. As such, our recommended stance on the dollar is neutral over the next few months. Our highest conviction bets are short EUR/JPY and long Swiss franc trades. Valuations tend to matter when most investors least expect them to. On this basis, we are negative the dollar on a 12-to-18 month time horizon. Place a limit sell on CHF/SEK at 10.76. TRADES* INITIATION DATE PERCENT RETURNS Short EUR/JPY 2022-07-21 2.73% Bottom Line: Stand aside on the dollar for now. Continue to opportunistically play trades at the crosses. Short EUR/JPY bets make sense as a volatility hedge. Chart 1Any Dollar Bears Left?
Any Dollar Bears Left?
Any Dollar Bears Left?
In our conversations with clients, it is rare to find a dollar bear these days. One barometer is price action – the dollar DXY index is up 18% from its 2021 lows. More instructively, net long speculative positions are near a multi-decade high (Chart 1). In our meetings, we sense a specter of capitulation among fundamental dollar bears, as the macroeconomic environment becomes more uncertain. For chart enthusiasts, the DXY index staged a classic breakout, and the next technical level is closer to the 2002 highs near 120. We doubt the DXY index will hit this level, as significant headwinds are building. It is true that as markets increasingly price in the probability of a recession, especially in Europe, the dollar will be bought. But as we argue below, the dollar has already priced in a recession, deeper than was the case in 2020 (or admittedly, at any time since the end of the Bretton Woods system). This suggests that investors with a relatively benign economic backdrop should be fading any strength in the dollar. In other words, if your bet on a recession is low odds, fade dollar strength relatively to your colleagues. As such, our recommended stance on the dollar is neutral over the next few months, but bearish for investors with a longer-term horizon. For today, our highest conviction bets are short EUR/JPY and long Swiss franc trades. The US Dollar And Global Growth Chart 2The Dollar Tracks Global Growth
The Dollar Tracks Global Growth
The Dollar Tracks Global Growth
There are many important drivers of the US dollar. One is the path for global growth. If global activity is going to slow meaningfully, then as a countercyclical currency, the dollar tends to rise in that environment. The dollar has been closely correlated (inversely) to the trend in global PMIs, industrial production, and other measures of global growth (Chart 2). Across the world, global growth is slowing (Chart 3). Most manufacturing PMIs in the developed world peaked in the middle of last year. In the developing world, China’s zero Covid-19 policy has nudged many PMIs close to the 50 boom/bust level. As a rule of thumb, you do not want to be short the greenback when global industrial activity is slowing. That is the bull case. Chart 3AGlobal Growth Is Slowing In Developed Markets
Global Growth Is Slowing In Developed Markets
Global Growth Is Slowing In Developed Markets
Chart 3BGrowth Is Also Soft In Emerging Markets
Growth Is Also Soft In Emerging Markets
Growth Is Also Soft In Emerging Markets
The good news for dollar bears is that most of this information is already priced in. Looking back at recessions since the 1970s, the dollar is pricing in one of the most anticipated slowdowns in history (Chart 4). This alone is not a reason to turn bearish on the greenback, but it is a red flag towards the consensus view. In general, currencies are a relative game. The dollar tends to rise 10%-to-15% during recessions. We are already there, with the DXY index up 18% since the 2021 lows. It is also important to gauge how the US is faring relative to the rest of the world. Quite simply, US economy economic activity is deteriorating vis-à-vis its trading partners. This is visible in the Citigroup economic surprise indices, but also via a simple chart of relative PMIs (Chart 5). Historically, that has been a negative for the greenback outside of recessions. Chart 4The Dollar Overshoots During Recessions
How Deep A Recession Is The Dollar Pricing In?
How Deep A Recession Is The Dollar Pricing In?
Chart 5US Economic Momentum Is Deteriorating
US Economic Momentum Is Deteriorating
US Economic Momentum Is Deteriorating
The US Dollar And Interest Rates The Fed hiked interest rates by 75bps this week. This was as expected but given what the Bank of Canada delivered on July 13th, a 100bps hike was a whisper number in our books. More importantly, interest rate differentials (real and nominal) are increasingly moving against the US. As we go to press, 10-year bond yields are 2.67% in the US, but 2.62% in Canada, 3.41% in New Zealand, and even 3.1% in Australia. Chart 6The Euro And Relative Interest Rates
The Euro And Relative Interest Rates
The Euro And Relative Interest Rates
The key point is that the market consensus is centered around the Fed being the most hawkish central bank. That will face a critical test in the next few months, if the world enters a recession. This is especially true in the euro area. The market is pricing that interest rates in the eurozone will be 200bps lower next year, relative to the US (Chart 6). The historical spread between US and German 2-year yields has been 83 bps. If Europe indeed enters a deep recession, then that is already priced in the euro. If we get any green shoots in economic growth, then the euro is poised for a coiled-spring rebound. The market is also pricing in that US interest rates will peak next year, relative to other G10 economies (Chart 7). This could happen in one of two ways: The Fed turns more dovish and/or non-US growth loses steam, leading to lower interest rates outside the US. It is difficult to forecast how the economic scenario will evolve, but from an investor’s standpoint, the dollar has already overshot the level implied by relative interest rates (Chart 8). Chart 7US Short Real Yields Are Attractive
How Deep A Recession Is The Dollar Pricing In?
How Deep A Recession Is The Dollar Pricing In?
Chart 8The Dollar Has Overshot Rate Fundamentals
The Dollar Has Overshot Rate Fundamentals
The Dollar Has Overshot Rate Fundamentals
A Short Note On USD Valuations Valuations usually get little respect, especially over the last few years. The bull market in the dollar from 2011 to 2022 coincided with higher real interest rates in the US relative to the rest of the developed world. That said, a rising trade deficit (imports > exports) requires a lower exchange rate to boost competitiveness in the manufacturing sector, or less spending to reduce the trade deficit. Therefore, the natural adjustment mechanism for countries running wide trade deficits will have to be the exchange rate. Quite simply, rising deficits are a symptom of an overvalued exchange rate. Within a broad spectrum of developed and emerging market currencies, the US dollar is overvalued on a real effective exchange rate basis (Chart 9 and 10). While valuations tend to matter less until they trigger a tipping point, such inflections usually occur with a shift in animal spirits, especially when investors start to worry about huge external imbalances. Chart 9The Dollar Is Overvalued
The Dollar Is Overvalued
The Dollar Is Overvalued
Chart 10The Dollar Is One Of The Most Expensive Currencies
How Deep A Recession Is The Dollar Pricing In?
How Deep A Recession Is The Dollar Pricing In?
In the US, these imbalances are already starting to spark a shift. The US trade deficit has deteriorated. The basic balance in the US (the sum of the current account and foreign direct investment) is deteriorating. The dollar tends to decline on a multi-year basis when the basic balance peaks and starts deteriorating. It is remarkable that at a time when real rates are quite negative in the US, the dollar is the most overvalued in decades on a simple PPP model basis. This is a perfect mirror image of the dollar configuration at the start of the bull market in 2010, where the dollar was cheap and real rates were more supportive. According to economic theory, a currency should adjust to equalize returns across countries. In the early 80s, an expensive dollar was supported by very positive real rates. The subsequent dollar declines thereafter also coincided with falling real interest rates. If global growth shifts from relative strength in the US to overseas, interest rate differentials will tilt in favor of non-US markets. That will be solace for dollar bears. Conclusions In financial markets, it pays to be humble but also to be bold. Our recommended stance on the DXY (and by association, the euro and cable) is to stay on the sidelines. Our highest conviction trade is to short EUR/JPY. With the drop in commodity prices, resource-related currencies are becoming interesting, a topic we will discuss in upcoming bulletins. But momentum is your friend for now, which suggests prudence. Chester Ntonifor Foreign Exchange Strategist chestern@bcaresearch.com Strategic View Cyclical Holdings (6-18 months) Tactical Holdings (0-6 months) Limit Orders Forecast Summary
Listen to a short summary of this report. Executive Summary US Lead On Mega-Sized Firms: Is A Peak Nigh?
America's Lead On Mega-Sized Companies: Is A Peak Nigh?
America's Lead On Mega-Sized Companies: Is A Peak Nigh?
The US has been the star protagonist of global equity markets for decades. It offers investors the rare combination of a big economy and a large universe of mega-sized listed companies. In fact, the overwhelming majority of the top 20 largest firms globally by revenue today are American. But can the US maintain this degree of presence on this list over the next decade? We think that this is unlikely. For starters, a decline in the US’s footprint could be driven by the fact that there is a peculiar stagnation in the works in the middle tier of American firms. Given that this tier acts as a talent pool for big firms, a stagnation here could mean that the US spawns fewer super-sized firms. The high market share commanded by big American firms could also end up being a liability. This dominance could bait regulatory attention, thereby affecting these firms’ growth prospects. Finally, slowing GDP growth in the US, as compared to its Asian peers, will prove to be another headwind that American firms must contend with. What should strategic investors do to prepare for this tectonic shift? We recommend reducing allocations to US equities over the long run since the US’s weight in global indices will peak soon (or may have already peaked). Bottom Line: Irrespective of what the Fed does (or does not do), the US’s footprint in the global league tables of big firms by revenue will weaken over the next decade. Strategic investors can profit from this change by reducing allocations to US equities while increasing allocations to China as well as a basket of countries including Korea, Japan, Taiwan, and Germany. Dear Client, This week, we are sending you a Special Report by Ritika Mankar, CFA, who will be writing occasional special reports for the Global Investment Strategy service on a variety of topical issues. Ritika makes the case that the US economy’s ability to spawn mega-sized companies may become increasingly compromised over the next decade. We will return to our regular publishing schedule next week. Best Regards, Peter Berezin, Chief Global Strategist US: Home To The Largest Number Of Big Listed Firms 2022 has been a turbulent year for US markets so far. But it is worth bearing in mind that the US has been the star protagonist of global equity markets for decades. This is because the US has offered investors a near-perfect trifecta constituting of: (1) A mega-sized economy; (2) A large universe of mega-sized listed companies; and (3) A track record of market outperformance. Specifically: Largest Economy: For over a century now, the US has been the largest economy in the world – a title it is expected to defend over the next few years (Chart 1). Large Listed Companies: The US’s high nominal GDP has also translated into high sales growth for its listed space. This, in turn, powered a great rise in the American equity market’s capitalization (Chart 2). In fact, the US’s market cap is so large today that it exceeds the cumulative market cap of the next four largest economies in the world, by a wide margin. So unlike Germany or China (which have large economies but small markets), the US has a large economy and is also home to some of the largest, most liquid stocks globally. Chart 1The US Will Remain The World’s Largest Economy For The Next Few Years
America's Lead On Mega-Sized Companies: Is A Peak Nigh?
America's Lead On Mega-Sized Companies: Is A Peak Nigh?
Chart 2The Listed Universe In The US Has Grown From Strength To Strength
America's Lead On Mega-Sized Companies: Is A Peak Nigh?
America's Lead On Mega-Sized Companies: Is A Peak Nigh?
Chart 3Growing Sales In The US Have Powered Its Outperformance Over The Past Decade
Growing Sales In The US Have Powered Its Outperformance Over The Past Decade
Growing Sales In The US Have Powered Its Outperformance Over The Past Decade
Long History of Outperformance: And most importantly, the US market has a strong track record of outperformance. US markets have outperformed global benchmarks over the past decade thanks largely to the rapid sales growth seen by American firms (Chart 3). Notwithstanding the US’s star role in global markets thus far, in this report we highlight that the US’s heft will likely decline over the next decade. The Fed may or may not administer recession-inducing rate hikes in 2022. But irrespective of what the Fed does over the next 12-to-24 months, the US’s loss of influence in global equity markets appears certain because it will be driven by structural forces. Chart 4US Lead On Mega-Sized Firms: Is A Peak Nigh?
America's Lead On Mega-Sized Companies: Is A Peak Nigh?
America's Lead On Mega-Sized Companies: Is A Peak Nigh?
Firstly, while behemoths such as Apple and Amazon have been attracting record investor attention, it is worth noting that the next tier of mid-sized American companies is no longer thriving as it used to. The reason why this matters is because history suggests that the pool of mid-sized companies acts as a superset for the big companies of tomorrow. So, if this talent pool is not booming today in the US, then there is likely to be repercussions tomorrow. Secondly, the US’s largest firms will have to contend with two structural headwinds over the next decade, namely increased regulatory attention and slowing growth. To complicate matters for American firms, competitors in Asia will not have this albatross around their neck. Hence, the US may remain the largest economy of the world a few years from now but is unlikely to be home to as many big, listed companies as it is today (Chart 4). The rest of this report quantifies the strength of these forces, and then concludes with actionable investment ideas. Trouble In The Talent Pool Chart 5The US Is Home To Nearly A Dozen Mega-Sized Firms Today
America's Lead On Mega-Sized Companies: Is A Peak Nigh?
America's Lead On Mega-Sized Companies: Is A Peak Nigh?
2021 produced a special milestone for the American economy. This was the first year that ten listed American firms1 surpassed $200 billion in annual revenues (firms we refer to as ‘Big Shots’ from here on) (Chart 5). The US has been a global leader when it came to the size of its economy for decades, but last year it also became home to the largest number of big, listed corporations (Table 1). American Big Shots were striking both in terms of their number as well as their scale. In fact, such was their scale that the combined revenue of these ten Big Shots now exceeded the nominal GDP of major economies like India (Chart 6). Table 1The US Today Dominates The Global List Of Top 20 Firms
America's Lead On Mega-Sized Companies: Is A Peak Nigh?
America's Lead On Mega-Sized Companies: Is A Peak Nigh?
Chart 6The Revenues Of US Big Shot Firms Are Comparable To India’s Nominal GDP!
America's Lead On Mega-Sized Companies: Is A Peak Nigh?
America's Lead On Mega-Sized Companies: Is A Peak Nigh?
While the world has been captivated by the size that the US’s Big Shots have achieved (as well as the ideas of their unconventional founders), few have noticed that the talent pool for tomorrow’s Big Shots is no longer burgeoning. History suggests that most Big Shot firms tend to emerge from firms belonging to a lower revenue tier. For instance, Amazon and Apple, which have revenues in the range of $350-to-$500 billion today, were mid-sized firms a decade ago with revenues in the vicinity of $50-to-$100 billion (Chart 7). Chart 7Most Big Shots Today Were The Mid-Sized Firms Of Yesterday
America's Lead On Mega-Sized Companies: Is A Peak Nigh?
America's Lead On Mega-Sized Companies: Is A Peak Nigh?
This is why it is worrying that all is not well in the US’s ecosystem of mid-sized firms. If we define firms with annual revenues of $50-to-$200 billion as ‘core’ firms, then their share in the total number of American firms has stagnated over the past decade (Chart 8). Even the revenue share accounted for by core firms has been fading (Chart 9). This phenomenon contrasts with the situation in China, where the mid-sized firms’ cohort has been growing over the last decade (Charts 10 and 11). Chart 8Share Of Mid-Sized Firms In The US Has Stagnated
America's Lead On Mega-Sized Companies: Is A Peak Nigh?
America's Lead On Mega-Sized Companies: Is A Peak Nigh?
Chart 9The Revenue Share Of US Mid-Sized Firms Is Also Falling
America's Lead On Mega-Sized Companies: Is A Peak Nigh?
America's Lead On Mega-Sized Companies: Is A Peak Nigh?
Chart 10Share Of Mid-Sized Firms In China Is Expanding
America's Lead On Mega-Sized Companies: Is A Peak Nigh?
America's Lead On Mega-Sized Companies: Is A Peak Nigh?
Chart 11The Revenue Share Of Chinese Mid-Sized Firms Is Rising
America's Lead On Mega-Sized Companies: Is A Peak Nigh?
America's Lead On Mega-Sized Companies: Is A Peak Nigh?
Japan’s experience also suggests that when the mid-sized firms’ ecosystem weakens, the pipeline of future potential mega-cap companies get affected. In Japan, the proportion of core firms (Chart 12), as well as their revenue share (Chart 13), has not been growing as is the case, say, in China. And this is perhaps why, despite being the third-largest economy in the world today, Japan is home to only one listed mega-sized corporation with revenues of over $200 billion (Toyota).
Image
Chart 13The Revenue Share Of Japanese Mid-Sized Firms Has Plateaued
America's Lead On Mega-Sized Companies: Is A Peak Nigh?
America's Lead On Mega-Sized Companies: Is A Peak Nigh?
The US May Have Hit Peak Oligopolization The fact that ten Big Shot firms (i.e., firms with annual revenues of over $200 billion) exist in the US today is remarkable. After all, the number of Big Shot firms in the US today exceeds the total number of Big Shots in the next four largest economies of the world combined (Chart 14). Chart 14The US Today Is The Global Hub For Mega-Sized Companies
America's Lead On Mega-Sized Companies: Is A Peak Nigh?
America's Lead On Mega-Sized Companies: Is A Peak Nigh?
So why will the US’s leadership in this area come under pressure going forward? One reason is that the large size of American firms could itself become a liability. Specifically: Public Backlash Against The US’s Big Shots: The ten Big Shot firms of the US today account for more than a fifth of the revenue generated by all firms that constitute the MSCI US index (Chart 15). Also, the number of Big Shot firms, as a share of total firms, is high in the US (Chart 16). Chart 15Big Shots Account For More Than A Fifth Of Revenues Generated By The US Listed Space
America's Lead On Mega-Sized Companies: Is A Peak Nigh?
America's Lead On Mega-Sized Companies: Is A Peak Nigh?
Chart 16A Large Proportion Of Firms In The US Are Very Big
America's Lead On Mega-Sized Companies: Is A Peak Nigh?
America's Lead On Mega-Sized Companies: Is A Peak Nigh?
Notably, market leaders across a range of key sectors in the US account for an unusually large chunk of the sector’s revenues. Financials, Information Technology, and Consumer Discretionary together account for about half of the US equity market index’s weight. The dominant firm in each of these three sectors (as defined by MSCI) accounts for 15%-to-25% of that sector’s revenue (Chart 17). Market power usually benefits investors. But too much market power can be a problem. The growing oligopolization of the US economy has caused public dissatisfaction over the influence of corporations in the US to hit a multi-year high (Chart 18). Over 60% of Americans want major US corporations to have less influence. It is for this reason that the record scale acquired by American firms could prove to be an issue. American mega-scaled firms’ high market shares will provide them with pricing power, but this very power will end up baiting regulatory attention and anti-trust lawsuits which, in turn, will restrict their future growth rates. The fact that the US Federal Trade Commission (FTC) today is headed by a leader who wants to return the FTC to its trust-busting origins, and made her name by writing a paper arguing for Amazon to be broken up,2 is indicative of which way the wind is blowing. Chart 17Market Leaders In The US Are Too Big
America's Lead On Mega-Sized Companies: Is A Peak Nigh?
America's Lead On Mega-Sized Companies: Is A Peak Nigh?
Chart 18Public Dissatisfaction With US Big Shot Firms Is High And Rising
America's Lead On Mega-Sized Companies: Is A Peak Nigh?
America's Lead On Mega-Sized Companies: Is A Peak Nigh?
Interestingly, the speed at which the US restricts the market power of big firms will determine how quickly the US’s mid-sized firms begin to flourish again, thereby setting the stage for the US to spawn a new generation of big firms. Besides the growing regulatory risks for the US’s big firms, three other technical factors will end up slowing the pace at which the US can generate large firms, namely: Slowing GDP Growth: Since the US is a large and mature economy, the pace of its growth is bound to slow (Chart 19). Besides the deceleration in the US’s growth rate relative to its own past, it is projected to end up being lower than that of major economies like China. Chart 19US GDP Growth Is Set To Slow
America's Lead On Mega-Sized Companies: Is A Peak Nigh?
America's Lead On Mega-Sized Companies: Is A Peak Nigh?
Big Business ≠ Big GDP Growth: While GDP growth receives a fillip when small firms grow, the high pricing power that very large firms command can end up constraining an economy’s growth rate. This is because large firms can charge monopolistic prices, thereby restraining demand. Secondly, mega-sized firms may actively invest in manipulating institutions to block upstarts,3 a dynamic that can restrict productivity growth as well. Chart 20The Revenue-To-Nominal GDP Ratio Is Already Elevated In The US
America's Lead On Mega-Sized Companies: Is A Peak Nigh?
America's Lead On Mega-Sized Companies: Is A Peak Nigh?
Approaching Revenue Saturation: A cross-country comparison suggests that the revenue-to-nominal GDP ratio in the US is high1 (Chart 20). Only Japan has a superior ratio, which is likely to be an aberration rather than the norm (owing to Japanese firms’ unique tendency to prioritize revenues over profitability). Given that the US revenue-to-nominal GDP ratio is already elevated, it is likely that even as the US’s nominal GDP keeps growing, the pace of conversion of this GDP into revenues will stay the same or may even diminish over the coming decade. Prepare For A Brave New World “German judges…first read a description of a woman who had been caught shoplifting, then rolled a pair of dice that were loaded so every roll resulted in either a 3 or a 9. As soon as the dice came to a stop, the judges were asked whether they would sentence the woman to a term in prison greater or lesser, in months, than the number showing on the dice…On average, those who had rolled a 9 said they would sentence her to 8 months; those who rolled a 3 said they would sentence her to 5 months; the anchoring effect was 50%.” – Daniel Kahneman, Thinking, Fast and Slow (Farrar, Straus and Giroux, 2011) The US has been the largest economy in the world and has also been able to nurture some of the largest mega-scaled companies of today. Such is the might and size of these firms that it is impossible to imagine a world where American firms’ leadership could be disrupted. Moreover, it is mentally easier to extrapolate the US’s lead today into the future. It may even seem like there is no other alternative to the US since Japan’s economy has been stagnating, Europe lacks innovation, and the political environment in China is contentious. Also, it is true that the US today is the undisputed leader when it comes to qualitative factors such as the ability to attract top global talent, its education system, and its legal system. However, the case can be made that this belief (that the US’s lead on mega-sized companies will spill into the next decade) runs the risk of becoming a Kahneman-esque anchoring bias. This is because: History Suggests That Upsets Are The Norm: History suggests that the evolution of the top 20 global firms (by revenue) has been a story of upsets. For instance, Europe’s hold over this list in the 2000s was striking by all accounts (Chart 21). Back then, it would have been almost blasphemous to question Europe’s lead (Chart 22). But today firms from three Asian island-countries account for more companies on this list than all of pre-Brexit Europe put together. Chart 21In The 2000s, Europe Was The Epicenter Of Global Mega-Sized Firms
America's Lead On Mega-Sized Companies: Is A Peak Nigh?
America's Lead On Mega-Sized Companies: Is A Peak Nigh?
Chart 22How The Mighty Can, And Do, Fall
America's Lead On Mega-Sized Companies: Is A Peak Nigh?
America's Lead On Mega-Sized Companies: Is A Peak Nigh?
China’s Disadvantages < Its Competitive Advantages: Despite its political baggage, China has the most formidable capability today to displace the US’s leadership position on the league tables of top 20 global firms by revenue. This is because China has a thriving ecosystem of core firms (Chart 11) and is set to grow at a faster clip than the US over the next five years (Chart 19). Moreover, while the Chinese government’s tolerance for large tech giants could remain low, the establishment could be keen to grow firms in the industrials as well as financials space for the sake of common prosperity. EM Listed Space Can Catch Up: The listed space in the US has developed at an exceptionally fast pace relative to its peers. The gap between US nominal GDP and listed space parameters is low (Chart 20), while the gap is wider for countries like Germany, China, and several other EMs. Even in a ceteris paribus situation where nominal GDPs were to stay static, an increase in the size of the listed universe in other countries can adversely affect the US’s current footprint. So, what can investors do to prepare for this coming tectonic shift? We recommend reducing allocations to US equities since the US’s weight in global indices will peak soon. It is worth noting that this strategic investment recommendation dovetails nicely with our earlier view that strategic investors should rotate out of US stocks. Currently, about half of the 20 largest firms globally by revenue are American (Map 1). Owing to the dynamics listed above, the number of American firms in the global league of top 20 could fall from this high level to 7 or 8 over the coming decade. Given that this change is indicative of things to come, we would urge investors to reduce allocations to US equities in a global portfolio over a strategic horizon. A confluence of micro and macro factors is likely to result in the US’s weight in global indices to crest sooner rather than later. Map 1Could The Global Epicenter Of Big Firms Drift Eastwards Over The Next Decade?
America's Lead On Mega-Sized Companies: Is A Peak Nigh?
America's Lead On Mega-Sized Companies: Is A Peak Nigh?
In fact, US equities’ weight in a global index like the MSCI ACWI could have already peaked (Chart 23) and could fall by 500-to-600bps over the next decade if the last year’s trend is extrapolated into the future. As regards to sectors, health care appears to be the key industry where the US’s footprint could weaken (Table 2). Chart 23Loss Of US Influence Will Create Space For Underrepresented Markets To Grow
America's Lead On Mega-Sized Companies: Is A Peak Nigh?
America's Lead On Mega-Sized Companies: Is A Peak Nigh?
Table 2China’s Weight In Top 20 Firms Is Set To Grow
America's Lead On Mega-Sized Companies: Is A Peak Nigh?
America's Lead On Mega-Sized Companies: Is A Peak Nigh?
As the US cedes its leadership position, we expect the global epicenter of mega-sized listed corporates to drift eastwards (Map 1). Specifically: China: Currently, less than a quarter of the 20 largest firms globally by revenue are Chinese (Map 1). It is highly likely that the number of Chinese firms in the global list of top 20 firms will increase. China should be able to spawn more mega-sized companies since it already has a cache of promising large and mid-sized companies. Chinese companies will also benefit from the high growth rate of China’s domestic economy. From a sectoral perspective, financials and industrials appear to be two sectors where China’s footprint could grow the most (Table 2). Asia Ex-China: Asian countries like Korea, Taiwan, and Japan could potentially end up growing their weight in global equity indices by becoming home to more than one company that makes it to the global league tables of large companies. Besides the high GDP growth rate on offer in their domestic markets (Chart 20), firms in these countries could increase scale by feeding a stimulus-fueled industrial boom in the US. Additionally, these Asian countries have a competitive advantage when it comes to high-tech manufacturing capabilities (Chart 24). This will ensure that they will accrue any offshore opportunities that arise. Taiwan has the potential to grow its presence in the Information Technology space, given its innate competitive advantages (Chart 24) and the positive structural outlook for global semiconductor demand. In the case of India, it is worth noting that the country’s influence in the world economy will be ascendant over the next decade as its growing middle class flexes its muscles. Despite this, the probability of an Indian firm making an appearance among the largest firms of the world is low given the unusually small size of Indian companies today. Europe: Distinct from the Asian countries listed above, Germany could benefit from the industrial boom in the US given its capabilities when it comes to high-end manufacturing (Chart 24). Even as we believe that oil faces a bleak future on a structural basis, if a commodities supercycle were to take hold over the next decade, then the UK and France could improve their presence in global equity benchmarks given that Europe is home to some large firms in the energy sector. A commodities supercycle will also end up benefiting China and the US, since some large energy producers are also located in these countries. Chart 24Korea, Japan, And Germany Have An Edge In Manufacturing, While Taiwan, Japan, And China Have An Edge In Semiconductors
America's Lead On Mega-Sized Companies: Is A Peak Nigh?
America's Lead On Mega-Sized Companies: Is A Peak Nigh?
Appendix The Methodology The starting point for most country-level economic analyses tends to be a country’s nominal GDP. But as market economists we realized that some key advantages could be unlocked by focusing on ‘revenues’ generated by the listed universe of a country. These advantages include: Investment Focus: As compared to nominal GDP which ends up picking up signals about the health of the listed ‘and’ unlisted firms in any country, focusing on listed firms’ revenues allows us to home-in on the health of the listed space. This is a valuable merit since the listed space is what public equity investors can buy into. For example, India is the fifth largest economy of the world and is also one of the fastest growing economies globally. But India is also characterized by a listed space where the largest companies have revenues of only around $100 billion. This makes India less investable than countries like Taiwan or South Korea that have far smaller nominal GDPs as compared to India but are home to firms with revenue of around $200 billion. Taking note of this difference - between the size of a country’s nominal GDP and the size of investable firms in a country - is key for our clients. Focus On Cause, Not Effect: It is fashionable today in the financial press to focus on the daily changes in market capitalization of assets (and non-assets too). But it is critical to note that the market cap of a stock or the price of a security is a dependent variable. Revenue, on the other hand, is a key independent variable that influences prices. So, a focus on forecasting movement in revenues of companies in a country ten years down the line, can be a more fruitful exercise for strategic investors. Steady And Stable: Revenue generated by a firm, is also a superior measure as compared to the market capitalization of a firm because the latter can be volatile. Whilst it could be argued that earnings of a company as a variable also offer stability and influence prices, earnings suffer from one drawback which is that it is a function of revenues as well as costs. Revenues of companies on the other hand have a direct theoretical link to the nominal GDP of a country. So, to rephrase a popular adage - market cap is vanity, nominal GDP is sanity, but revenue is king. This is the reason why in this Special Report, we analyze investment opportunities through the lens of revenues generated by listed firms in some of the largest economies of the world. We do so by focusing on the constituents of MSCI Country Indices (Equity) for major world economies in 2021. Ritika Mankar, CFA Editor/Strategist ritika.mankar@bcaresearch.com Footnotes 1 Based on MSCI ACWI data for 2021. 2 Kiran Stacey, “Washington vs Big Tech: Lina Khan’s battle to transform US antitrust,” ft.com, August 2021. 3 Kathy Fogel, Randall Morck, and Bernard Yeung, “Big Business Stability And Economic Growth: Is What’s Good For General Motors Good For US?”, NBER Working Paper No. 12394, nber.org, July 2006.
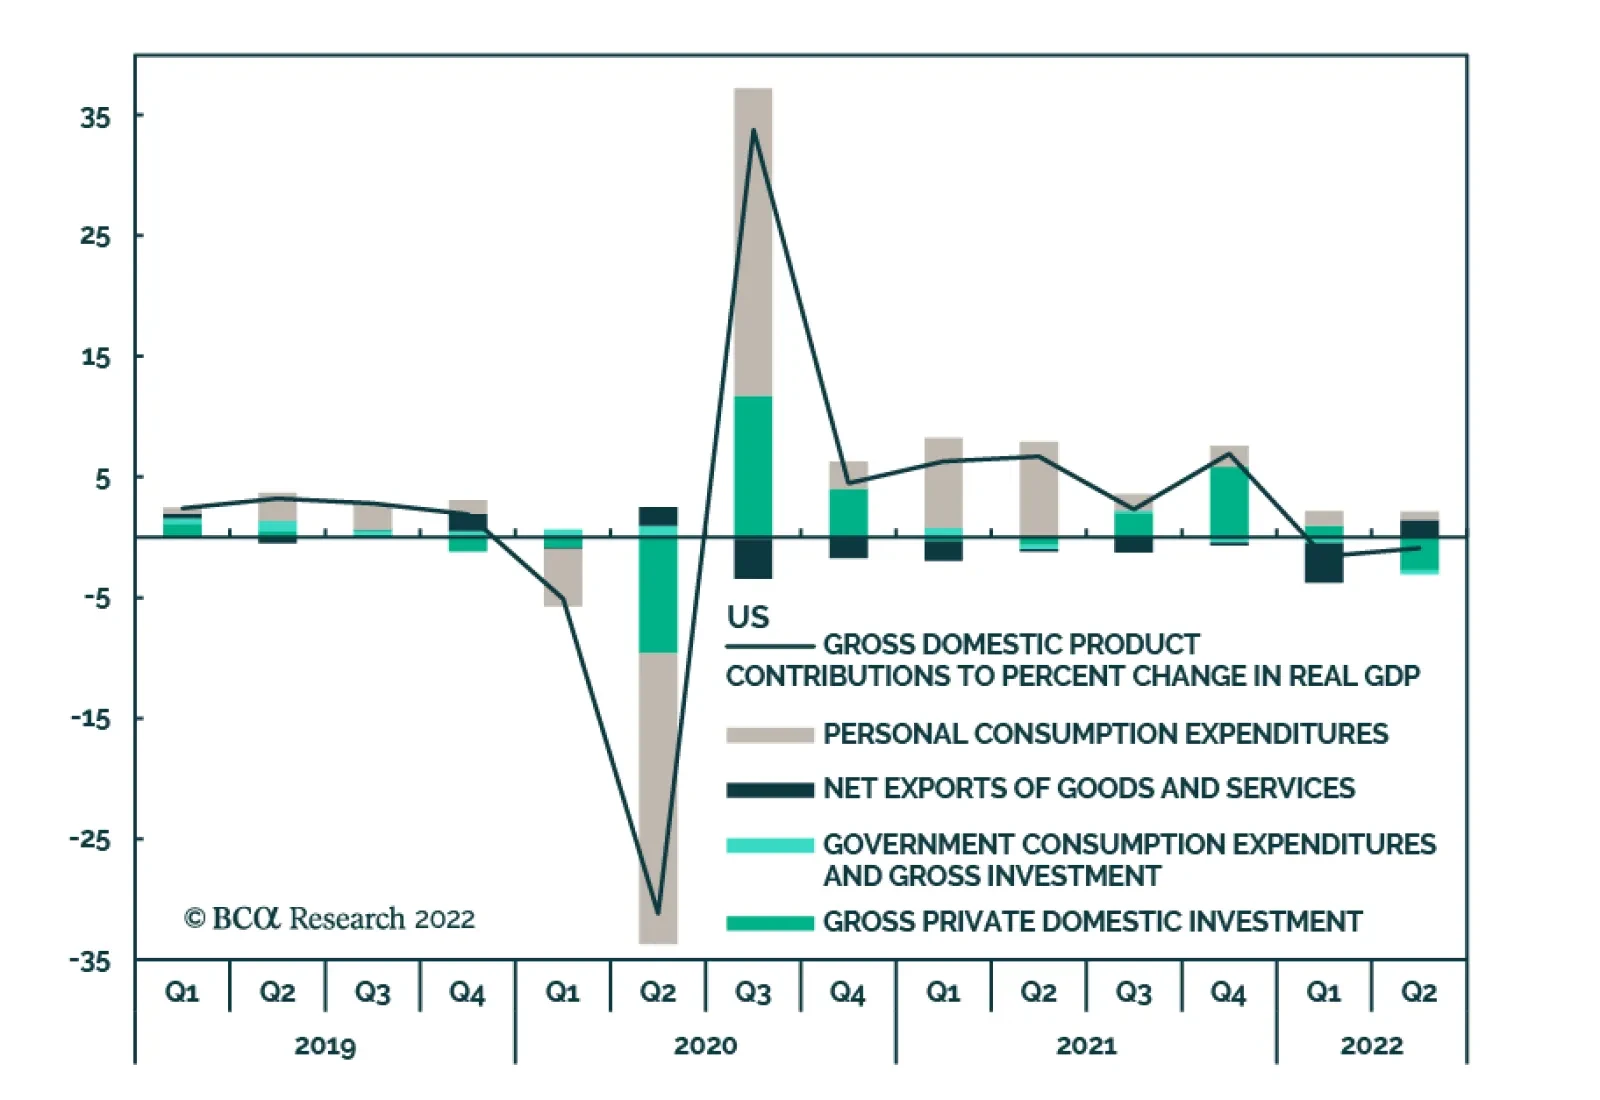
Preliminary estimates indicate that real US GDP growth declined by an annualized 0.9% in Q2, marking the second consecutive decline and against expectations it would return to positive growth. Private domestic business investment was the largest negative…