United States
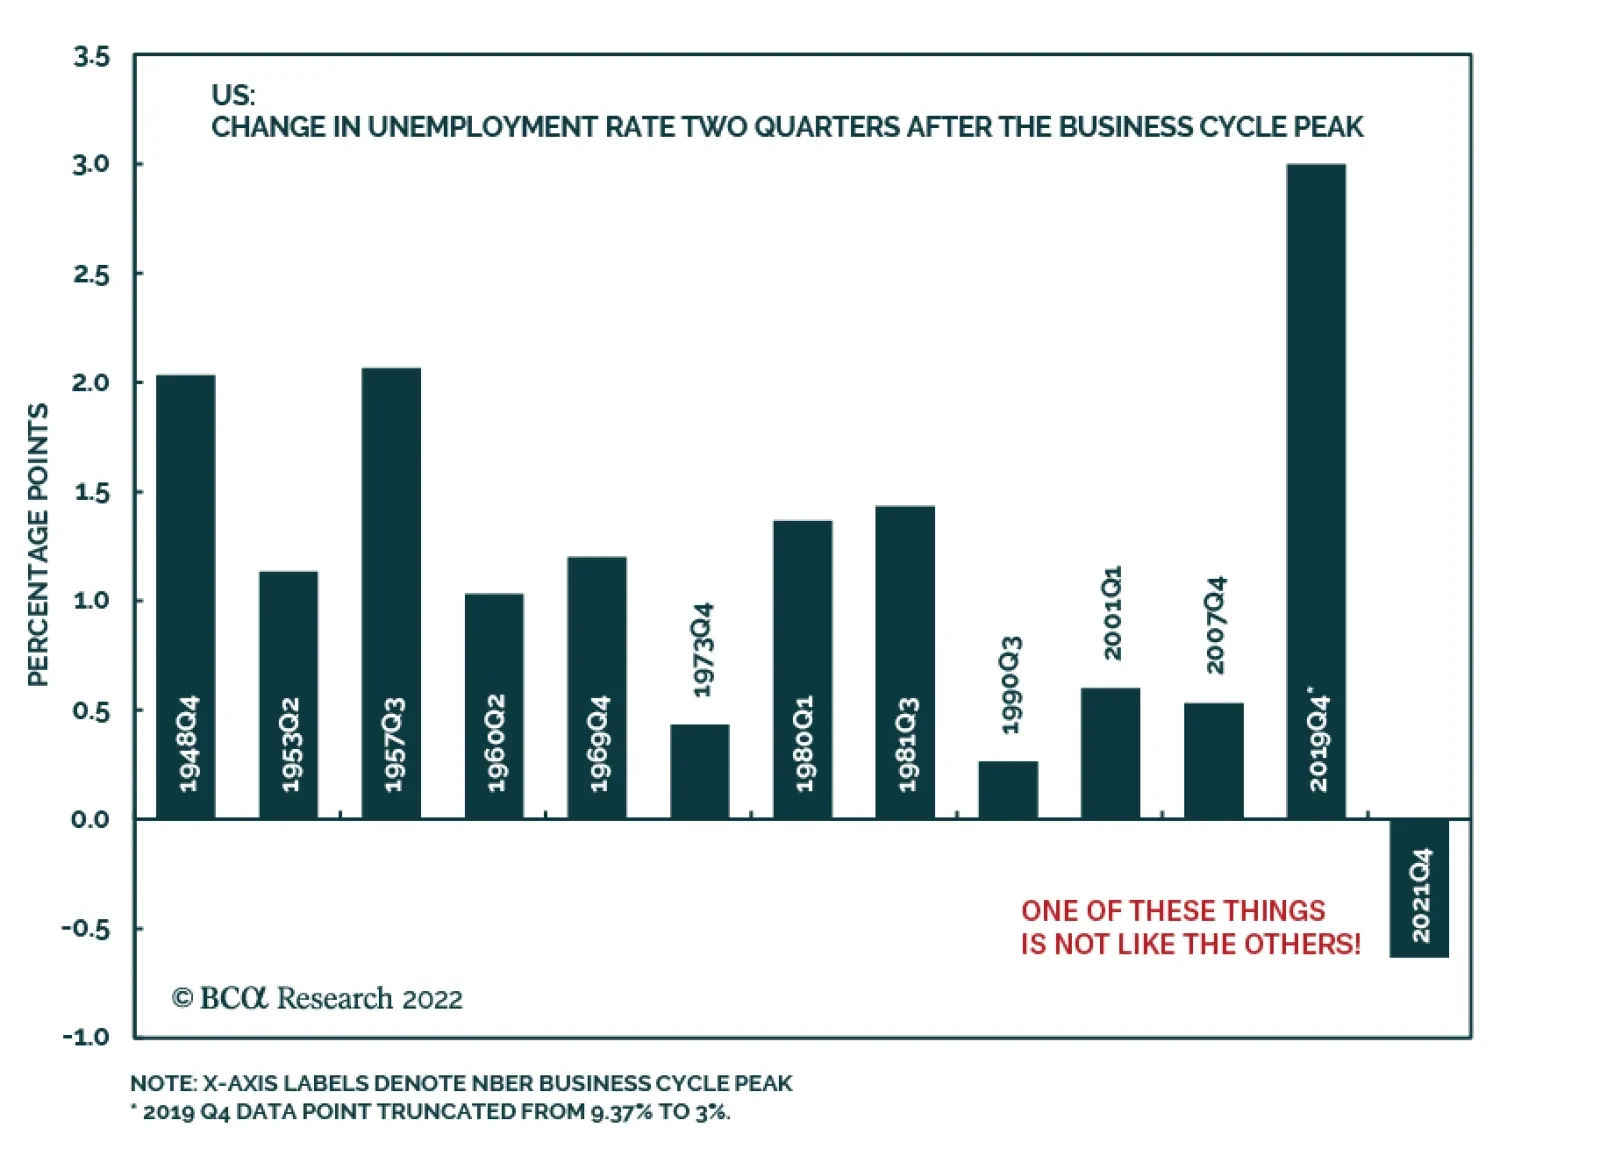
The Q2 GDP contraction is fueling fears that the US economy is in recession (see The Numbers). Regardless of whether this is indeed the case – i.e. whether the advance release will be revised and, whether the NBER classifies it as one – there are two key…

Executive Summary If a loss of wealth persists for a year or more, it hurts the economy. The recent $40 trillion slump in global financial wealth is larger than that suffered in the pandemic of 2020, the global financial crisis of 2008, and the dot com bust of 2000-01. Partly countering this slump in global financial wealth is a $20 trillion uplift in global real estate wealth. However, Chinese home prices are already stagnating. And the recent disappearance of US and European homebuyers combined with a flood of home-sellers warns that US and European home prices will cool over the next 6 months. With the loss of wealth likely to persist, it will amplify a global growth slowdown already in train, aided and abetted by central banks that are willing to enter recession to slay inflation. The optimal asset allocation over the next 6-12 months is: overweight bonds, neutral stocks, and underweight commodities. A variation on this theme is: overweight conventional bonds and stocks versus inflation-protected bonds and commodities. Fractal trading watchlist: US telecoms versus utilities, and copper. We Have Just Suffered The Worst Loss Of Financial Wealth In A Generation
The World Is $20 Trillion Poorer. Why That Matters
The World Is $20 Trillion Poorer. Why That Matters
Bottom Line: On a 6-12 month horizon, overweight bonds, neutral stocks, and underweight commodities. Feature Since the end of last year, the world has lost $40 trillion of financial wealth, evenly split between the crashes in stocks and bonds (Chart I-1). The slump in financial wealth, both in absolute and proportionate terms, is the worst suffered in a generation, larger than that in the pandemic of 2020, the global financial crisis of 2008, and the dot com bust of 2000-01.1 Chart I-1Global Stocks And Global Bonds Have Both Slumped By $20 Trillion
Global Stocks And Global Bonds Have Both Slumped By $20 Trillion
Global Stocks And Global Bonds Have Both Slumped By $20 Trillion
Partly countering this $40 trillion slump in global financial wealth is a $20 trillion uplift in global real estate wealth. But in total, the world is still $20 trillion ‘asset poorer’ than at the end of last year. Given that global GDP is around $100 trillion, we can say that we are asset poorer, on average, by about one fifth of our annual income. Does this loss of wealth matter? A Loss Of Wealth Matters If It Persists For A Year Or More Some argue that we shouldn’t worry about the recent slump in our wealth, because we are still wealthier than we were, say, at the start of the pandemic (Chart I-2). Yet this is a facile argument. Whatever loss of wealth we suffer, there is always some point in the past against which we are richer! Chart I-2We Have Just Suffered The Worst Loss Of Financial Wealth In A Generation
We Have Just Suffered The Worst Loss Of Financial Wealth In A Generation
We Have Just Suffered The Worst Loss Of Financial Wealth In A Generation
Another argument is that people do not care about a short-lived dip in their wealth. This argument has more truth to it. For example, in the extreme event of a flash crash, an asset price can drop to zero and then bounce back in the blink of an eyelid. In this case, most people would be oblivious, or unconcerned, by this momentary collapse in their wealth. But people do care if the slump in their wealth becomes more prolonged. How long is prolonged? The answer is, if the slump persists for a year or more. Why a year? Because that is the timeframe over which governments, firms, and households make their income and spending plans. Governments and firms do this formally in their annual budgets that set tax rates, wages, bonuses, and investment spending. Households do it informally, because their wages, bonuses, and taxes – and therefore disposable incomes – also adjust on an annual basis. Into this yearly spending plan will also come any change in wealth experienced over the previous year. For example, firms often do this formally by converting an asset write-down to a deduction from profits, which will then impact the firm’s future spending. This illustrates that what impacts your spending is not the level of your wealth, but the yearly change in your wealth. Spending Is Impacted By The Change In Wealth The intellectual battle here is between Economics and Psychology. The economics textbooks insist that it is the level of your wealth that impacts your spending, whereas the psychology and behavioural finance textbooks insist that it is the change in your wealth that impacts your spending. (Chart I-3and Chart I-4). In my view, the psychologists and behavioural finance guys have nailed this better than the economists, through a theory known as Mental Accounting Bias. Chart I-3The Change And Impulse Of Stock Market Wealth Are Both Negative
The Change And Impulse Of Stock Market Wealth Are Both Negative
The Change And Impulse Of Stock Market Wealth Are Both Negative
Chart I-4The Change And Impulse Of Bond Market Wealth Are Both Negative
The Change And Impulse Of Bond Market Wealth Are Both Negative
The Change And Impulse Of Bond Market Wealth Are Both Negative
Nobel Laureate psychologist Daniel Kahneman points out that we categorise our money into different accounts, which are sometimes physical, sometimes only mental – and that there is a clear hierarchy in our willingness to spend these ‘mental accounts’. Put simply, we are willing to spend our income mental account, but we are much less willing to spend our wealth mental account. Still, wealth can generate income through interest payments and dividends, which we are willing to spend. Clearly, the level of income generated will correlate with the amount of wealth – $10 million of wealth will likely generate much more income than $1 million of wealth. So, economists get the impression that it is the level of wealth that impacts spending, but the truth is that it is the income generated by the wealth that impacts spending. We are willing to spend our income ‘mental account’, but we are much less willing to spend our wealth ‘mental account’. What about someone like Amazon founder Jeff Bezos who has immense wealth but seemingly negligible income – Mr. Bezos receives only a token salary, and his huge holding of Amazon shares pays no dividend – how then can we explain his largesse? The answer is that Mr. Bezos’ immense wealth generates tens of billions in trading income. So again, it is his income that is driving his spending. Wealth also generates an ‘income substitute’ via capital gains. For example, you should be indifferent between a $100 bond giving you $2 of income, or a $98 zero-coupon bond maturing in one year at $100, giving you $2 of capital gain. In this case the capital gain is simply an income substitute and fully transferred into the spending mental account. Nowhere is this truer than in China, where the straight-line appreciation in house prices through several decades has allowed homeowners to regard a reliable capital gain as an income substitute (Chart I-5). Which justifies rental yields on Chinese housing that are the lowest in the world and lower even than the yield on risk-free cash. In other words, which justifies a stratospheric valuation for Chinese real estate.
Image
Usually though, we tend to transfer only a proportion of our capital gains or losses into our spending mental account. As described previously, a firm will do this formally by transferring an asset write-down into the income statement. And households will do it informally by transferring some proportion of their yearly change in wealth into their spending mental account. The important conclusion is that spending is impacted by the yearly change in wealth. Meaning that spending growth is impacted by the yearly change in the yearly change in wealth, known as the wealth (1-year) impulse, where a negative impulse implies negative growth. Cracks Appearing In The Housing Market Given the recent slump in financial wealth, the global financial wealth impulse is in deeply negative territory. Yet by far the largest part of our wealth comprises housing, meaning the value of our homes2 (Chart I-6). In China, the recent stagnation of house prices means that the housing wealth impulse has turned negative. Elsewhere in the world though, the recent boom in house prices means that the housing wealth impulse is still positive, meaning a tailwind – albeit a rapidly fading tailwind – to spending (Chart I-7 and Chart I-8). Chart I-6Housing Comprises By Far The Largest Part Of Our Wealth
Housing Comprises By Far The Largest Part Of Our Wealth
Housing Comprises By Far The Largest Part Of Our Wealth
Chart I-7Chinese House Prices Have Stagnated, US House Prices Have Surged
The World Is $20 Trillion Poorer. Why That Matters
The World Is $20 Trillion Poorer. Why That Matters
Chart I-8The Chinese Housing Wealth Impulse Is Negative, The US Housing Wealth Impulse Is Fading
The Chinese Housing Wealth Impulse Is Negative, The US Housing Wealth Impulse Is Fading
The Chinese Housing Wealth Impulse Is Negative, The US Housing Wealth Impulse Is Fading
In China, the recent stagnation of house prices means that the housing wealth impulse has turned negative. Still, as we explained in The Global Housing Boom Is Over, As Buying Becomes More Expensive Than Renting, the disappearance of homebuyers combined with a flood of home-sellers is a tried and tested indicator that US and European home prices will cool over the next 6 months. US new home prices have already suffered a significant decline in June (Chart I-9). Some of this is because US homebuilders are building smaller and less expensive homes. Nevertheless, it seems highly likely that the non-China housing wealth impulse will also turn negative later this year. Chart I-9US New Home Prices Fell Sharply In June
US New Home Prices Fell Sharply In June
US New Home Prices Fell Sharply In June
To be clear, the wealth impulse is just one driver of spending growth. Nevertheless, it does have the potential to amplify the growth cycle in either direction. With global growth clearly slowing, and central banks willing to enter recession to slay inflation, the rapidly fading global wealth impulse will amplify the slowdown. Therefore, the optimal asset allocation over the next 6-12 months is: Overweight bonds. Neutral stocks. Underweight commodities. A variation on this theme is: Overweight conventional bonds and stocks versus inflation-protected bonds and commodities. Fractal Trading Watchlist After a 35 percent decline since March, copper has hit a resistance point on its short-term fractal structure, from which it could experience a countertrend move. Hence, we are adding copper to our watchlist. Of note also, the underperformance of US telecoms versus utilities has reached the point of fragility on its 260-day fractal structure that has signalled previous major turning points in 2012, 2014, and 2017 (Chart I-10). Hence, the recommended trade is long US telecoms versus utilities, setting a profit target and symmetrical stop-loss at 8 percent. Chart I-10US Telecoms Versus Utilities Are At A Potential Turnaround
US Telecoms Versus Utilities Are At A Potential Turnaround
US Telecoms Versus Utilities Are At A Potential Turnaround
Fractal Trading Watchlist: New Additions Copper’s Selloff Has Hit Short-Term Resistance
Copper's Selloff Has Hit Short-Term Resistance
Copper's Selloff Has Hit Short-Term Resistance
Dhaval Joshi Chief Strategist dhaval@bcaresearch.com Footnotes 1 The value of global equities has dropped by $20tn to $80tn, the value of global bonds by $20tn to around $100tn, while the value of global real estate has increased by $20tn to an estimated $370tn. 2 Strictly speaking, housing wealth should be measured net of the mortgage debt that is owed on our homes. But as the wealth impulse is a change of a change, and mortgage debt changes very slowly, it does not matter whether we calculate the impulse from gross or net housing wealth. Chart 1CNY/USD At A Potential Turning Point
CNY/USD At A Potential Turning Point
CNY/USD At A Potential Turning Point
Chart 2Copper's Selloff Has Hit Short-Term Resistance
Copper's Selloff Has Hit Short-Term Resistance
Copper's Selloff Has Hit Short-Term Resistance
Chart 3US REITS Are Oversold Versus Utilities
US REITS Are Oversold Versus Utilities
US REITS Are Oversold Versus Utilities
Chart 4CAD/SEK Is Reversing
CAD/SEK Is Reversing
CAD/SEK Is Reversing
Chart 5Financials Versus Industrials Has Reversed
Financials Versus Industrials Has Reversed
Financials Versus Industrials Has Reversed
Chart 6The Outperformance Of Resources Versus Biotech Has Ended
The Outperformance Of Resources Versus Biotech Has Ended
The Outperformance Of Resources Versus Biotech Has Ended
Chart 7The Outperformance Of Resources Versus Healthcare Has Ended
The Outperformance Of Resources Versus Healthcare Has Ended
The Outperformance Of Resources Versus Healthcare Has Ended
Chart 8FTSE100 Outperformance Vs. Euro Stoxx 50 Is Vulnerable To Reversal
FTSE100 Outperformance Vs. Euro Stoxx 50 Is Vulnerable To Reversal
FTSE100 Outperformance Vs. Euro Stoxx 50 Is Vulnerable To Reversal
Chart 9Netherlands' Underperformance Vs. Switzerland Has Ended
Netherlands' Underperformance Vs. Switzerland Has Ended
Netherlands' Underperformance Vs. Switzerland Has Ended
Chart 10The Sell-Off In The 30-Year T-Bond At Fractal Fragility
The Sell-Off In The 30-Year T-Bond At Fractal Fragility
The Sell-Off In The 30-Year T-Bond At Fractal Fragility
Chart 11The Sell-Off In The NASDAQ Is Approaching Fractal Fragility
The Sell-Off In The NASDAQ Is Approaching Fractal Fragility
The Sell-Off In The NASDAQ Is Approaching Fractal Fragility
Chart 12Food And Beverage Outperformance Is Exhausted
Food And Beverage Outperformance Is Exhausted
Food And Beverage Outperformance Is Exhausted
Chart 13German Telecom Outperformance Has Started To Reverse
German Telecom Outperformance Has Started To Reverse
German Telecom Outperformance Has Started To Reverse
Chart 14Japanese Telecom Outperformance Vulnerable To Reversal
Japanese Telecom Outperformance Vulnerable To Reversal
Japanese Telecom Outperformance Vulnerable To Reversal
Chart 15ETH Is Approaching A Possible Capitulation
ETH Is Approaching A Possible Capitulation
ETH Is Approaching A Possible Capitulation
Chart 16The Strong Trend In The 18-Month-Out US Interest Rate Future Has Ended
The Strong Trend In The 18-Month-Out US Interest Rate Future Has Ended
The Strong Trend In The 18-Month-Out US Interest Rate Future Has Ended
Chart 17The Strong Downtrend In The 3 Year T-Bond Has Ended
The Strong Downtrend In The 3 Year T-Bond Has Ended
The Strong Downtrend In The 3 Year T-Bond Has Ended
Chart 18A Potential Switching Point From Tobacco Into Cannabis
A Potential Switching Point From Tobacco Into Cannabis
A Potential Switching Point From Tobacco Into Cannabis
Chart 19Biotech Is A Major Buy
Biotech Is A Major Buy
Biotech Is A Major Buy
Chart 20Norway's Outperformance Has Ended
Norway's Outperformance Has Ended
Norway's Outperformance Has Ended
Chart 21Cotton Versus Platinum Has Reversed
Cotton Versus Platinum Has Reversed
Cotton Versus Platinum Has Reversed
Chart 22Switzerland's Outperformance Vs. Germany Is Exhausted
Switzerland's Outperformance Vs. Germany Is Exhausted
Switzerland's Outperformance Vs. Germany Is Exhausted
Chart 23USD/EUR Is Vulnerable To Reversal
USD/EUR Is Vulnerable To Reversal
USD/EUR Is Vulnerable To Reversal
Chart 24The Outperformance Of MSCI Hong Kong Versus China Has Ended
The Outperformance Of MSCI Hong Kong Versus China Has Ended
The Outperformance Of MSCI Hong Kong Versus China Has Ended
Chart 25A Potential New Entry Point Into Petcare
A Potential New Entry Point Into Petcare
A Potential New Entry Point Into Petcare
Chart 26GBP/USD At A Potential Turning Point
GBP/USD At A Potential Turning Point
GBP/USD At A Potential Turning Point
Chart 27US Utilities Outperformance Vulnerable To Reversal
US Utilities Outperformance Vulnerable To Reversal
US Utilities Outperformance Vulnerable To Reversal
Chart 28The Outperformance Of Oil Versus Banks Is Exhausted
The Outperformance Of Oil Versus Banks Is Exhausted
The Outperformance Of Oil Versus Banks Is Exhausted
Fractal Trading System Fractal Trades
The World Is $20 Trillion Poorer. Why That Matters
The World Is $20 Trillion Poorer. Why That Matters
The World Is $20 Trillion Poorer. Why That Matters
The World Is $20 Trillion Poorer. Why That Matters
6-12 Month Recommendations Structural Recommendations Closed Fractal Trades Indicators To Watch - Bond Yields Chart II-1Indicators To Watch - Bond Yields - Euro Area
Indicators To Watch - Bond Yields - Euro Area
Indicators To Watch - Bond Yields - Euro Area
Chart II-2Indicators To Watch - Bond Yields - Europe Ex Euro Area
Indicators To Watch - Bond Yields - Europe Ex Euro Area
Indicators To Watch - Bond Yields - Europe Ex Euro Area
Chart II-3Indicators To Watch - Bond Yields - Asia
Indicators To Watch - Bond Yields - Asia
Indicators To Watch - Bond Yields - Asia
Chart II-4Indicators To Watch - Bond Yields - Other Developed
Indicators To Watch - Bond Yields - Other Developed
Indicators To Watch - Bond Yields - Other Developed
Indicators To Watch - Interest Rate Expectations Chart II-5Indicators To Watch - Interest Rate Expectations
Indicators To Watch - Interest Rate Expectations
Indicators To Watch - Interest Rate Expectations
Chart II-6Indicators To Watch - Interest Rate Expectations
Indicators To Watch - Interest Rate Expectations
Indicators To Watch - Interest Rate Expectations
Chart II-7Indicators To Watch - Interest Rate Expectations
Indicators To Watch - Interest Rate Expectations
Indicators To Watch - Interest Rate Expectations
Chart II-8Indicators To Watch - Interest Rate Expectations
Indicators To Watch - Interest Rate Expectations
Indicators To Watch - Interest Rate Expectations
US services spending collapsed during the COVID-19 pandemic, and remains significantly below the level that would have prevailed had the pandemic not occurred. This raises the question of whether services consumption will ever return to “normal.” In this report, we address this question by examining the weakest components of services spending, with an eye towards any evidence indicating that this weakness is permanent. A category analysis of services spending highlights that the spending gap currently exists due to a combination of work-from-home trends and evidence of lasting aversion to COVID-19. The latter is unlikely to be permanent, and the former will be partially or fully offset by a permanent increase in substitutable goods spending. In a non-recessionary scenario, our analysis suggests that the US services spending gap will continue to close, which will provide support for overall consumption as goods spending slows in response to weak real wage growth and higher interest rates. The COVID-19 pandemic has been enormously disruptive, socially as well as economically. In the US, a massive shift from services to goods spending represents one of the most significant economic disruptions caused by the pandemic, which persists even today. Chart II-1The Pandemic Caused An Extreme Shift In Spending From Services To Goods
The Pandemic Caused An Extreme Shift In Spending From Services To Goods
The Pandemic Caused An Extreme Shift In Spending From Services To Goods
Chart II-1 presents our best estimate of the real goods and services spending gaps relative to potential GDP, which illustrates how extreme the shift from services to goods has been. The real goods spending gap exploded during the pandemic to a level that had not been seen since the early-1950s, and services spending collapsed in an unprecedented fashion and remains at a level that is lower than at any other point over the past seven decades (aside from the worst of the pandemic itself). Chart II-2 highlights that the overall output and household consumption gaps have not yet turned positive, despite an extremely strong labor market. This underscores that weak services spending is playing a role in depressing consumption, and thus overall economic activity. Chart II-2Weak Services Spending Is Playing A Role In Depressing Consumption
Weak Services Spending Is Playing A Role In Depressing Consumption
Weak Services Spending Is Playing A Role In Depressing Consumption
This persistent weakness in services spending raises the question of whether services consumption will ever return to “normal,” defined as the level of spending that would have likely prevailed had the pandemic never occurred. In this report we address this question by examining the weakest components of services spending, with an eye towards any evidence indicating that this weakness is permanent. We conclude that the services spending gap currently exists due to a combination of WFH trends and evidence of lasting aversion to COVID-19. While the effect of the former may be permanent, we do not believe that the effect of the latter will be. And, in cases where certain categories of services spending are likely to be permanently lower, at least some of this decline in spending is likely to be partially or fully offset by a permanent increase in substitutable goods spending. In a non-recessionary scenario, our analysis suggests that the US services spending gap will continue to close, which will provide support for overall consumption as goods spending slows in response to weak real wage growth and higher interest rates. The Pandemic, Remote Work, And Services Spending During the very early phase of the pandemic, COVID-19 was spreading rapidly in industrialized economies. Following recommended or mandatory stay at home orders from governments in many countries, most office-based businesses rapidly shifted to work-from-home (WFH) arrangements as an emergency response. This, in conjunction with forced closures of “close contact” businesses such as restaurants, entertainment, and travel caused US services spending to collapse. However, by the summer of 2021, many of these pandemic control measures had been significantly eased or lifted in the US. In addition, several national US surveys found many office workers preferred the flexibility afforded by WFH arrangements. Many employers, correspondingly, found that the productivity of their employees did not suffer while working from home, or that it even improved. These findings led many in the business community to conclude that WFH policies are not, in fact, emergency measures that will ultimately be reversed and instead reflect the “new normal” for work. While this “new normal” is still in the process of being defined, it seems fairly clear that some form of hybrid work arrangements will be permanent for many businesses. Chart II-3 presents the Kastle Systems Back to Work Barometer, which reflects keycard swipes in office buildings in the top 10 US cities. The chart highlights that urban office building activity has recovered to less than half of its pre-pandemic level, and that there has been no evidence of a continued uptrend over the past 3 months. Chart II-4 reinforces this point by highlighting that public transit use in major US cities has lagged the recovery in air travel, and also has not substantially changed over the past few months. Chart II-3Urban Office Building Activity Has Recovered To Less Than Half Of Its Pre-Pandemic Level
Urban Office Building Activity Has Recovered To Less Than Half Of Its Pre-Pandemic Level
Urban Office Building Activity Has Recovered To Less Than Half Of Its Pre-Pandemic Level
Chart II-4Urban Public Transit Use Has Lagged The Recovery In Air Travel
Urban Public Transit Use Has Lagged The Recovery In Air Travel
Urban Public Transit Use Has Lagged The Recovery In Air Travel
This underscores that investors have a basis to question whether at least some US services spending may be permanently impaired by the pandemic, as was the case for overall output for several years following the 2008/2009 global financial crisis. To answer this question, we present a detailed review of the most lagging categories of US services spending on pages 8-15, focused on whether WFH trends and/or activity in central business districts can plausibly explain the gap in spending in each category. The US Services Spending Gap: Key Observations And Conclusions As discussed in greater detail below, we make the following observations about the US services spending gap: Among the seven major categories of US services spending, health care accounts for the largest portion of the services spending gap. Reduced health care spending has little to do with work from home trends, and more to do with an aversion to contracting the disease in a healthcare environment and the reluctance to place elderly relatives in nursing homes given the higher risk that COVID presents to those who are older. Some recreation services spending has been impacted by WFH trends and thus may be permanent, but a lingering fear of crowded indoor spaces and still-recovering international tourism appear to be more important drivers of the recreation services spending gap. Some portion of reduced transportation services spending may be permanent (either in whole or in part), as the spending gap in road transportation seems strongly connected to WFH trends. But the sizeable and impactful decline in real spending on motor vehicle leasing is likely to recover as motor vehicle production improves over the coming year, suggesting that transportation services spending will continue to improve over the coming year relative to its pre-pandemic trend even if a spending gap in this category of services spending is permanent or long-lasting. Personal care and clothing services is mostly responsible for the spending gap in other services, and clear WFH effects do suggest that a reduction in spending in this category may be permanent. However, these categories are relatively small, and in some cases have been partially offset by what is likely to be a permanently positive spending gap on equivalent goods. The takeaway for investors is that the services spending gap currently exists due to a combination of WFH trends and evidence of lasting aversion to COVID-19. While some investors may interpret these observations as suggesting that the gap will act as a permanent or long-lasting drag on consumer spending, we disagree for two important reasons. First, we agree that some form of hybrid work arrangements will be permanent for many businesses, and that a spending gap may be permanent or long-lasting for spending categories most closely tied to WFH effects. But this also suggests that the goods-equivalent spending that has occurred as a result of this decline in services spending will also be permanent. In other words, some of the drag that permanent WFH effects will have on overall consumer spending will be offset by a permanent increase in certain categories of goods spending. Chart II-5Some Of The Permanent Drag On Services Spending Will Be Offset By Permanently Higher Goods Spending
Some Of The Permanent Drag On Services Spending Will Be Offset By Permanently Higher Goods Spending
Some Of The Permanent Drag On Services Spending Will Be Offset By Permanently Higher Goods Spending
Chart II-5 highlights the sum of spending for two pairs of clearly substitutable services/goods categories: miscellaneous personal care services plus personal care products, and sporting equipment, supplies, guns, and ammunition plus membership clubs and participant sports centers. The chart highlights that the sum of these four categories is currently above its pre-pandemic trend, highlighting that permanently lower spending in some services categories affected by WFH trends will likely be offset by permanently higher spending in some goods categories. Second, we doubt that a strong aversion to a COVID-19 infection will be permanent, as the endemicity of the disease has yet to be recognized by the public and normalized by political leaders and health professionals. This is especially true given that the availability and awareness of Pfizer’s Paxlovid antiviral therapy is still in its early stages in the US, and remains severely restricted in other developed economies and (for now) essentially unavailable in the emerging world. As an additional point concerning the lingering societal fear of COVID-19, estimates for the likely annual disease burden from “endemic COVID” are now coming into focus. In a recent New York Times opinion piece, the author cited forecasts from a number of medical professionals that endemic COVID-19 will likely infect roughly half of the US population per year, and will kill on the order of 100,000-250,000 Americans annually.1 That compares with roughly 50,000 fatalities over the course of a year from the worst flu season experienced over the past decade, implying that COVID-19 will end up being between 2-5 times as bad over the longer term as worst-case flu. If the disease burden of endemic COVID-19 ends up being on the higher end of that estimate, then it is likely that an aversion to crowded spaces and shared human settings will be permanent. But we suspect that the eventually-widespread availability of Paxlovid – and other treatment options that have yet to be developed – makes it more likely that annual fatalities will be on the lower end of that range. Chart II-6“Endemic COVID” Will Still Be A Significant Killer, But It Will Not Likely Cause A Permanent Fear Of Crowded Spaces
August 2022
August 2022
While tragic, a disease with a fatality rate of 30 per 100,000 people (equivalent to 100,000 US deaths per year) will rank behind accidents, chronic lower respiratory diseases (such as bronchitis, emphysema, and asthma), stroke, and just in line with Alzheimer’s disease as a leading cause of death (Chart II-6). It is certainly unwelcome that a new leading cause of death has emerged. But given that COVID-19 will never go away, we doubt that this will be enough to cause a permanent change in public behavior, suggesting that US services spending will return to normal over time. To the extent that some services spending declines are permanent, we expect that to be partially or fully offset by a permanent increase in substitutable goods spending. Investment Conclusions As we discussed in Section 1 of our report, the risk of a US recession is quite elevated. In a non-recessionary scenario, our analysis suggests that the US services spending gap will continue to close, which will provide support for overall consumption as goods spending slows in response to weak real wage growth and higher interest rates. Chart II-7In A Nonrecessionary Scenario, Excess Savings Will Support Services Spending
In A Nonrecessionary Scenario, Excess Savings Will Support Services Spending
In A Nonrecessionary Scenario, Excess Savings Will Support Services Spending
Chart II-7 highlights that the excess savings that have accumulated since the onset of the pandemic – which can be deployed to support spending – have accrued heavily to upper income earners, who are typically responsible for a significant amount of services spending. While it is true that upper income earners have also suffered a significant wealth shock from the combined effect of falling stock and bond prices, we strongly suspect that excess savings and the transition to endemic COVID-19 will support services spending and cause it to move toward the level that would have prevailed had the pandemic not occurred. In a recessionary scenario, we doubt that services spending would fall significantly, given that it is still extraordinarily depressed relative to history. However, some cyclical categories of services spending would decline, and Chart II-1 highlighted that services spending does tend to decline during recessions. The key point for investors is that changes in services spending would not be large enough to cushion a meaningful decline in goods spending were a recession to emerge. While the emergence of a US recession is not yet a foregone conclusion, the risk that it will occur is an important reason supporting our a neutral asset allocation stance. As noted in Section 1 of our report, further signs of an impending recession would cause us to recommend that investors underweight risky assets over the coming 6-12 months. Jonathan LaBerge, CFA Vice President The Bank Credit Analyst Gabriel Di Lullo Research Associate Overall Household Consumption Expenditures for Services Household consumption expenditures for services is composed of seven categories of services spending: Housing and Utilities, Health Care, Transportation Services, Recreation Services, Food Services and Accommodations, Financial Services and Insurance, and Other Services. In order to gauge to what degree services spending is likely to be permanently impaired by the COVID-19 pandemic, we estimate the “services spending gap” for each of these seven categories based on the pre-pandemic trend of overall services spending and the pre-pandemic weight of each category (Chart II-8). Chart II-8The Services Spending Gap Is Fairly Broad-Based
August 2022
August 2022
Spending fell in all seven services categories during the early phase of the COVID-19 pandemic, but the pace of their respective recoveries has been varied. Spending in many of these sectors has not yet fully recovered relative to its pre-pandemic trend (Charts II-9 and 10), contributing to a spending gap of more than $350 billion real dollars.2 Chart II-8 presents a breakdown of this spending gap by category, and we analyze the drivers of each of these gaps by examining subcategories of services spending on pages 8-15. Our subcategory analysis focuses on areas of services spending that are well below their pre-pandemic level, rather than relative to the hypothetical level of spending that would have prevailed had the pandemic not occurred. This is due to BEA data limitations that prevent us from accurately attributing category spending gaps to subcategories in real terms. Charts II-8-10 underscore that the services spending gap is very broad-based. However, four categories stand out as being particularly impactful: health care, recreation services, transportation services and other services. We discuss the causes of the spending gap in these four categories below, with the goal of determining whether they will likely abate as the pandemic continues to recede, or whether they are likely to be permanent. Chart II-9Four Categories Of Services Spending Stand Out…
Four categories Of Services Spending Stand Out...
Four categories Of Services Spending Stand Out...
Chart II-10…As Being Particularly Impactful Drivers Of The Services Spending Gap
...As Being Particularly Impactful Drivers Of The Services Spending Gap
...As Being Particularly Impactful Drivers Of The Services Spending Gap
Health Care Real US personal consumption on health care services is currently $126 billion below our estimate of its pre-pandemic trend, and is currently just below its pre-pandemic level (Chart II-11). “Missing” health care spending accounts for the largest share of the overall spending gap for household consumption expenditures for services. Chart II-11“Missing” Health Care Spending Accounts For A Large Part Of The Overall Services Spending Gap
August 2022
August 2022
Health care spending initially experienced a V-shaped recovery following the onset of the pandemic, but the pace of recovery has since slowed. The sectors displaying the most significant deviations from their pre-pandemic levels are physician services, dental services, and nursing home spending (Chart II-12). The gap in spending on hospital, physician, and dental services is clearly related to the COVID-19 pandemic, in the sense that some households likely fear contracting the disease in a healthcare setting (especially given the invasive nature of dental treatments). It is also possible that households have been visiting doctor and dentist offices less frequently due to work-from-home policies, in cases where these offices were located in or adjacent to central business districts. Nursing home spending is very much the outlier in the health care sub-sectors, in the sense that its recovery has been more U-shaped than V-shaped. As the pandemic placed the elderly at great risk, we suspect that many family members decided to remove them from nursing homes (or postpone moving them into a nursing home), due to the concern that a communal living environment significantly increased the risk of COVID exposure. Bottom Line: We strongly doubt that the gap in healthcare services spending is permanent. The increasing availability of Paxlovid should help physician services, dental services, and nursing home spending recover, although it is possible that nursing home spending will be the most lagging of the three. Still, we expect that the health care services spending gap will close meaningfully over the coming year if a US recession is avoided (and possibly even if a recession does occur). Chart II-12Some Households Likely Fear Contracting COVID In A Healthcare Setting
Some Households Likely Fear Contracting COVID In A Healthcare Setting
Some Households Likely Fear Contracting COVID In A Healthcare Setting
Chart II-13Lingering Fears Of Crowded Indoor Spaces And Still Weak Tourism Explain Weak Recreation Services Spending
Lingering Fears Of Crowded Indoor Spaces And Still Weak Tourism Explain Weak Recreation Services Spending
Lingering Fears Of Crowded Indoor Spaces And Still Weak Tourism Explain Weak Recreation Services Spending
Recreation Services Real spending on recreation services is currently $75 billion below its pre-pandemic trend, and remains well below its pre-pandemic level (Chart II-14). Despite only accounting for 6% of household consumption expenditure for services, the sharp decline in spending in certain sub-sectors of recreation services has been large enough to significantly contribute to the overall services spending gap. Chart II-14The Recreation Services Spending Gap: Concerts, Amusement Parks, Movies, And Gyms
August 2022
August 2022
Chart II-13 highlights that the sectors most responsible for the gap in recreation services spending are 1) live entertainment excluding sports, 2) amusement parks, campgrounds and related recreational services, 3) motion picture theatres, and 4) membership clubs and participant sports centers. A fairly clear narrative explains large spending gaps in three of these categories. In contrast to real spending on spectator sports, which is currently $9 billion above its pre-pandemic level, movies and concerts tend to be held indoors, underscoring that large spending gaps in these categories likely reflect lingering fears of contracting COVID in crowded indoor spaces. Membership clubs and participant sports centers spending is also explained by the COVID-fear effect, although some of the spending gap in this subcategory may be long-lasting as it is also seemingly related to work-from-home effects (for example, substituting home exercise equipment for gym memberships). Real spending on amusement parks, campgrounds and related recreational services is somewhat more difficult to explain, given that spending on these types of services tend to occur outdoors. In addition, some high-profile examples of amusement parks, such as those maintained by the Walt Disney Company in California and Florida, have seemingly experienced strong attendance compared with pre-pandemic levels. We suspect that weakness in this spending category reflects the fact that international tourism has yet to return to its pre-pandemic level. Over the past 12 months, visitor arrivals to the US, while rising, have been less than 40% of what prevailed prior to the pandemic. Bottom Line: We strongly doubt that a sizeable majority of the recreation services spending gap is permanent. As noted for healthcare spending, the increased availability of Paxlovid should progressively reduce the fear associated with crowded indoor spaces, which we believe will cause the recreation services spending gap to close meaningfully over the coming year if a US recession is avoided. Transportation Services Real spending on transportation services is currently $64 billion below our estimate of its pre-pandemic trend, and remains well below its pre-pandemic level (Chart II-15). Chart II-15Road Transportation And Motor Vehicle Leasing Are The Largest Contributors To The Transportation Services Spending Gap
August 2022
August 2022
Similar to recreation services spending, transportation services spending accounts for only 5% of household consumption expenditure for services, but the extent of the decline in certain categories of transportation services spending has significantly contributed to the overall gap in services spending. The sectors responsible for the transportation services spending gap are: road transportation, motor vehicle leasing, motor vehicle maintenance and repair, and parking fees and tolls (Chart II-16). Some of the gap in transportation services spending is related to work-from-home trends, and as such may be permanent (either in whole or in part). The decline in road transportation spending has been heavily driven by a collapse in spending on intercity buses and mass transit, which is strongly connected to reduced office building occupancy in major US cities and also appears to explain reduced spending on parking fees and tolls. In addition, weak motor vehicle maintenance and repair seems strongly correlated with retail and recreation mobility, which remains below its pre-pandemic level. However, reduced spending on motor vehicle leasing accounts for an important portion of the transportation services spending gap, and does not appear to be caused by work-from-home trends. Instead, the decline in leasing seems strongly linked to the decline in motor vehicle inventory that has caused an enormous rise in new and used car prices. As we have discussed at length in previous reports, this decline in vehicle production and sales has been caused by a semiconductor shortage that will eventually abate, underscoring that this subcomponent of transportation services spending will eventually recover. Bottom Line: We expect the transportation services spending gap to close further over the coming year, even if it does not close fully. Some portion of reduced transportation services spending may be permanent (either in whole or in part), but spending on motor vehicle leasing will not be, suggesting that transportation services spending will continue to improve over the coming year relative to its pre-pandemic trend if a contraction in the US economy is avoided. Chart II-16Some Of The Gap In Transportation Services Spending May Be Permanent
Some Of The Gap In Transportation Services Spending May Be Permanent
Some Of The Gap In Transportation Services Spending May Be Permanent
Chart II-17Personal Care And Clothing Services Spending Has Definitely Been Impacted By Work-From-Home Trends
Personal Care And Clothing Services Spending Has Definitely Been Impacted By Work-From-Home Trends
Personal Care And Clothing Services Spending Has Definitely Been Impacted By Work-From-Home Trends
Other Services Other services spending represents a 14% share of household consumption expenditure for services. Real spending on other services is currently $51 billion below our estimate of its pre-pandemic trend, and still below its pre-pandemic level (Chart II-18). In percentage terms, the other services spending gap is smaller than for health care, recreation services, and transportation services, but it is closer in dollar terms because other services spending is a larger expenditure category. Chart II-18Some Other Services Spending Is Higher Than Before The Pandemic, But Personal Care And Clothing Services Is The Laggard
August 2022
August 2022
Real spending on other services is below its pre-pandemic level in four subcategories: personal care and clothing services, education services, household maintenance, and social services and religious activities. However, the majority of the spending gap in other services is accounted for by personal care and clothing services (Chart II-17). Some components of personal care and clothing services spending are likely permanently impaired (in whole or in part). Almost all of clothing and footwear services spending is made up by spending on laundry and dry-cleaning services, which remains 12% below its pre-pandemic level and is not exhibiting any meaningful uptrend. In addition, within personal care services, spending on hairdressing salons and personal grooming establishments remains well below its pre-pandemic level, and is only slowly recovering in line with central business district office occupancy. However, one interesting aspect of personal care services spending is that spending on personal care products has increased significantly during the pandemic as spending on miscellaneous personal care services decreased. This suggests that any permanently negative spending gap on personal care and clothing services will be at least partially offset by a permanently positive spending gap on personal care products. Bottom Line: Some of the negative spending gap on other services is likely to be permanent or long-lasting due to persistent work-from-home effects, but at least some of this negative gap will be offset by a permanently positive spending gap on the goods equivalent of these services. Footnotes 1 New York Times Opinion, Endemic Covid-19 Looks Pretty Brutal, July 20, 2022 2 Please note that all real dollar references in this report refer to chained (2012) dollars.
The Global Investment Strategy service tactically downgraded equities in February but then upgraded them in May. The decision to upgrade equities to overweight in May was clearly premature, as stocks fell significantly in June. However, the rally in July has brought stocks back above the level where we upgraded them. Hence, we are using this opportunity to shift our recommended equity allocation back to neutral. While our base case forecast still foresees no recession in the US over the next 12 months, the risks to this view have increased. In Europe, we see a recession as more likely than not. China’s economy will remain under pressure due to Covid lockdowns, a shift in global spending away from manufactured goods, and a weakening property market. Even if the US avoids a recession, this could prove to be a bittersweet outcome for stocks: While earnings will hold up, the Fed is unlikely to cut rates next year, as markets are currently discounting. Real bond yields, which have already risen steeply this year, will rise further, weighing on equity valuations. Time to Take Some Chips Off the Table The consensus view among investors these days seems to be that the US is heading into a recession (or may already be in one), which will cause stocks to fall during the remainder of the year as earnings estimates are slashed. Looking out to 2023, most investors expect stocks to recover as the Fed begins to cut rates. I have the opposite view. While the risks to growth have increased, the US will probably avoid a recession over the next 12 months. This will allow stocks to rise modestly from current levels into year-end. However, as we enter 2023, it will become obvious that the Fed has no reason to cut rates. This could cause stocks to give up some of their gains, thus producing a fairly flat profile for equities over a 12-month horizon. In past reports, we have argued that the neutral rate of interest – the interest rate consistent with full employment and stable inflation – is higher than widely believed in the US. The nice thing about a high neutral rate is that it insulates the economy from tighter monetary policy: Even if the Fed raises rates to 3.8% next year, as the dots are currently forecasting, that will only put rates in the middle of our fair value range of 3.5%-to-4% for the US neutral rate. The downside of a high neutral rate is that eventually, investors will need to value stocks using a higher discount rate. The 10-year TIPS yield has already increased from -0.97% at the start of the year to +0.36% today. It will rise to 1%-to-1.5% by the middle of 2023. A higher-than-expected neutral rate also raises inflation risks because it could cause the Fed to inadvertently keep monetary policy too loose. Inflation is likely to fall significantly over the coming months as supply-chain bottlenecks ease. However, this decline in inflation could sow the seeds of its own demise: As inflation falls, real wage growth – which is now negative – will turn positive. Rising real wages will booster consumer confidence and spending. A reacceleration in inflation in the second half of next year could prompt the Fed to start hiking rates again in late 2023, thus producing a recession not in 2022 but in 2024. Outside the US, the outlook is more challenging. In Europe, a recession is more likely than not in the second half of the year. We expect the recession to be fairly short-lived, with European governments moving aggressively to mitigate the fallout from gas shortages through various income support schemes for the private sector. Chinese growth should rebound in the second half of the year. However, the specter of future lockdowns, the shift in global spending away from manufactured goods towards services, and the weakening property sector will continue to weigh on activity. We will have much more to say about this view change early next week. In the meantime, please review our report from last week entitled “The Downside Of A Soft Landing” for further color on some of the points made in this short bulletin. Tomorrow, my colleague Ritika Mankar will be sending you a Special Report making the case that the US economy’s ability to spawn mega-sized companies may become increasingly compromised over the next decade. Peter Berezin Chief Global Strategist peterb@bcaresearch.com Follow me on LinkedIn & Twitter.
Executive Summary Dollar Still The Largest Global Reserve Currency
Dollar Still Dominating Global Reserves
Dollar Still Dominating Global Reserves
The rise of cryptocurrencies like stablecoins theoretically pose risks to fiat currencies and their general use. In the US, the Federal Reserve will look to adopt a Central Bank Digital Currency (CBDC) – a digital dollar – this decade, to stave off these risks and usher in a new era of central bank money. A digital dollar would likely be integrated as seamlessly as possible into the current monetary regime, thereby maintaining an intermediated role played by existing financial sector actors as well as operating alongside existing circulating currency. The US dollar will eventually face rising competition from digital currencies, both at home and abroad. While other central banks make headway into developing their own CBDCs, China is by far the most advanced. China’s digital yuan will not resolve all of China’s problems with internationalizing its currency but it will create new opportunities. Public and political pushback will occur and will slow adoption of a digital dollar. Gridlock in 2023 may prove to be another headwind. To adopt a digital dollar, politicians will need to work along bipartisan lines to ensure the US remains at the forefront of digital and monetary innovation, especially as foreign competition on CBDCs rises. Recommendation (Tactical) Initiation Date Return Long DXY (Dollar Index) 23-FEB-22 10.7% Bottom Line: Policymakers will adopt a CBDC – a digital dollar – this decade. Political pushback may slow adoption, but foreign competition will overcome domestic constraints. Feature Technological innovation over the past decade has given rise to a new asset class – digital assets. Investors are most familiar with cryptocurrencies, and to a lesser extent, non-fungible tokens and decentralized finance-based lending, among others. These assets have witnessed a boom and bust over the past few years (Chart 1). Chart 1Manias: Then And Now
Manias: Then And Now
Manias: Then And Now
Cryptocurrencies have been touted to have money-like characteristics, the most popular being Bitcoin, and others like stablecoins. Stablecoins are mostly used as a medium of exchange between fiat money and cryptocurrencies and vice versa. They are pegged to fiat money and often backed by highly liquid traditional assets1 to maintain their pegs. But cryptocurrencies do not exhibit the traits of durable money today. However, the technological innovation of digital currency represents a natural evolution of money that is irreversible and could someday possess the main characteristics of money: a medium of exchange, a unit of account, and store of value. Cryptocurrencies with money-like qualities theoretically pose a challenge to fiat currencies, i.e. those issued by governments that are not backed by any underlying real asset but rather by trust in government institutions, including the treasury and central bank. Not that trust is a poor basis for a currency. But that trust could fail and new trust could be placed in cryptocurrencies. Governments could eventually lose control of the money supply and payments system, suffer from financial instability, fail to provide regulatory oversight, or fail to prevent the illicit use of digital assets for criminal gain. The same technology driving growth in digital assets has led central banks the world around to research and in some cases develop CBDCs. For an introductory guide to CBDCs, see BCA’s “The Investor’s Guide To Central Bank Digital Currencies.” CBDC research and development are at varying stages across the world’s central banks.2 In the US, the Federal Reserve (Fed) continues to research a CBDC (digital dollar) and its use-case, or justification for being. The Fed has made no commitment to designing a digital dollar anytime soon. But we bet that the Fed’s position will change in coming years. Introducing a digital dollar will reduce the various risks associated with cryptocurrencies whilst also creating efficiencies in the US economy. These efficiencies will also transverse into cross-border efficiencies. Globally, central banks are showing increasing activity in developing CBDCs and introducing a digital dollar would help the Fed maintain monetary dominance across the world while staving off cryptocurrencies, especially stablecoins. The Fed won’t sit idle as a global monetary revolution unfolds. But the policy front is fraught with challenges. Policy makers in the US have expressed mixed views on adopting a digital dollar. Some suggest the Fed would exercise even more control over monetary policy than it does today. Others note risks to consumer data privacy, which could be exploited by government. Public opinion is also mixed with no clear understanding of or need for a digital dollar. Commercial bank business interests may come under attack too, with a digital dollar scalping profit margins from banks, depending on the type and extent of the CBDC operating model employed. Ultimately, the US will want to maintain its position as the global monetary leader. Continued dollar dominance in the global economy is strategically advantageous for the US, especially in a hypo-globalizing world (Chart 2). Ensuring ongoing monetary dominance while rooting out domestic competition from stablecoins will be aided by adopting a digital dollar. Chart 2Dollar Still Dominating Global Reserves
Dollar Still Dominating Global Reserves
Dollar Still Dominating Global Reserves
Bottom Line: The Fed will most likely adopt a digital dollar within the decade. The Fed And A Digital Dollar The Fed has been actively researching a digital dollar for several years with growing research on design, implementation, and necessity. As it stands, the Fed has not committed to introducing a digital dollar in the foreseeable future. But what would a digital dollar look like and what role would it play in the economy if the Fed decided to introduce one? CBDC Model Briefly, the Fed could choose from three different CBDC operating models: unilateral, synthetic, or intermediated (Diagram 1). A unilateral model would mean the Fed performs all CBDC related functions including direct interaction with end-users. A synthetic model would mean non-Fed actors issuing money backed by Fed assets. Diagram 1Three CBDC Operating Models
Digital Dollar, Will US Policymakers Launch One Soon?
Digital Dollar, Will US Policymakers Launch One Soon?
Realistically, a unilateral and synthetic digital dollar are unlikely. The former would crowd out traditional banking services, while the latter would let actors other than the Fed issue money, violating the Federal Reserve Act. Hence the Fed will most likely pursue an intermediated CBDC model. This model entails digital dollar issuance by the Fed but includes a role for private sector firms to interact with end-users. The intermediary role would be filled by financial firms but also other types of companies such as payment service providers and mobile phone operators. This means the Fed would not totally crowd out existing players across the payment and financial services space. An intermediated model would require the central bank to regulate and oversee other actors, which adds an extra layer of legal and operational complexity to implementation. But it is the model most consistent with the US’s combination of federal government and liberal capitalism, and the model cited by the Fed to most likely be adopted.3 The intermediated model will align with the current two-tier system currently in place (Diagram 2). Digital dollars will feature in both wholesale and retail transactions. Wholesale involves commercial banks and regulated financial intermediaries, while retail involves individuals and non-financial businesses. The model would also operate alongside existing paper money. A digital dollar would be a liability on the Fed, denominated in dollars, and would form an integral part of base money supply (M0). It would be distributed like, and act as a complement to, dollar bills and could be used in transactions conducted in currency and reserves. It would be legal tender just like the paper dollar. Diagram 2Two-Tier Monetary Regime System
Digital Dollar, Will US Policymakers Launch One Soon?
Digital Dollar, Will US Policymakers Launch One Soon?
Digital Dollar Needs The Fed has stated that a digital dollar should, among other things, meet certain criteria before adoption (Table 1). Some of these criteria are already met. Others will be met with adoption. A digital dollar will benefit households, businesses, and the economy at large. For example, a digital dollar would enhance payment transparency, thereby supporting the Fed’s objective to promote safe and efficient payments. And depending on design choices, digital transactions could offer degrees of traceability and aggregate payment data could be analyzed in real time to provide insights into economic health and activity. Table 1Fed Criteria For CBDC Adoption
Digital Dollar, Will US Policymakers Launch One Soon?
Digital Dollar, Will US Policymakers Launch One Soon?
Further, a digital dollar would promote diversification of the payments system, thereby increasing the safety and efficiency of US payment infrastructure. It may also attract new actors offering services related to the digital dollar, spurring financial innovation and fostering financial integration. The payments system is already broadly efficient but adding another layer of digitization with a digital dollar would mean that the US economy would be better positioned for the evolution of the digital economy over the next decade and beyond. The need for broad stakeholder support will be a difficult criterion to meet, however. There would need to be more engagement with the public, inter-government agencies, and Congress. For now, these “needs” outlined by the Fed are more than half met, signaling that a digital dollar could come to fruition within the decade from a policy perspective. International advances on this front will spur US policy makers into action even if they are disinclined. Bottom Line: The needs outlined by the Fed to adopt a digital dollar have been mostly met which ticks off one of the policy implementation checkboxes. There are gains to be had across the economy by introducing a digital dollar, ranging from a more efficient payments system to financial inclusion and decreasing transactions costs. Domestic Competition The proliferation of stablecoins has been noted by government agencies around the world. The Fed too has been keeping note. By the end of 2021, stablecoins had a relatively small market capitalization compared to the broader cryptocurrency market, approximately 6%. Now, stablecoins account for almost 16% of cryptocurrency market capitalization. But trading volumes point to stablecoins having a much larger role in transactions (Chart 3). Stablecoins resolve some of the problems of faith and trust that bedevil cryptocurrencies not backed by traditional assets. Chart 3Stablecoins Rise In Popularity
Stablecoins Rise In Popularity
Stablecoins Rise In Popularity
Stablecoins pose two key threats that a digital dollar will essentially nullify: Systemic risk: A growing stablecoin market that is increasingly backed by traditional, high liquid assets could create systemic risk in traditional asset markets. An excessive rise or fall in demand for stablecoins would cause volatility in the liquid assets that back them. Moreover, for example, a fire sale in the stablecoin market would cause demand to fall excessively relative to the backing asset. Prices between stablecoins and the backing asset would diverge, potentially breaking the peg and resulting in further price divergence. And more broadly, high volatility from crypto markets can penetrate traditional or risk-free markets. A digital dollar would render stablecoins unnecessary, allowing cryptocurrency users to transact and convert digital dollars to cryptocurrency while enjoying the backing of the Fed on the value of digital dollars. Cross-border transactions: Stablecoins are also increasingly used for cross-border transactions. According to Fed data, the US pays 5.4% in fees on average per cross-border transaction, which also takes several days to settle. Stablecoins settle almost instantaneously and have much lower transaction fees. So too can a digital dollar. It would settle just as quickly as a stablecoin, if not quicker, and reduce transaction costs for cross-border payments. And because stablecoins are designed to maintain their pegs, they have more potential than cryptocurrencies to act as mediums of exchange outside of the crypto market and economy, potentially threatening the ongoing use of fiat money. Bottom Line: The Fed will design a CBDC around its existing monetary and payments system to allow for seamless integration. There are not many reasons holding back digital dollar adoption from a point of need and benefit. By adopting a digital dollar, the Fed will also fight off the growing risk of stablecoins, which could pose a threat to the use-case of fiat money in everyday life. Other Central Banks On The March The authority to issue money is an important element of economic power. History is replete with examples of currency competition both within countries and between them. CBDC research and development are picking up speed across central banks (Charts 4A and 4B). China is the world leader with its digital yuan, as we discuss below. Design and implementation of CBDCs will follow in coming years just like in the case of the digital yuan. If the theoretical payoffs to adopting a CBDC are met by real-world green shoots, then foreign CBDCs could pose a threat to continued dollar dominance in the global monetary and economic system, namely if countries can draw down their dependence on dollar reserves. Chart 4ACentral Banks Paying More Attention To CBDCs
Digital Dollar, Will US Policymakers Launch One Soon?
Digital Dollar, Will US Policymakers Launch One Soon?
Chart 4BCentral Banks Paying More Attention To CBDCs
Digital Dollar, Will US Policymakers Launch One Soon?
Digital Dollar, Will US Policymakers Launch One Soon?
Central Bank Competition Treasury Secretary Janet Yellen has noted this challenge in recent remarks explaining that any implementation of a “US central bank digital currency must support the prominent role the dollar plays in the global financial system.”4 The Fed is on the same page as the Treasury noting that any CBDC should be used to preserve the dominant international role of the dollar. The dollar is the world’s most widely used currency for payments and investments and serves as the world’s premier reserve currency. The dollar’s international role allows the US to influence the practices and standards of the global monetary and economic system. Basically, when the US constricts the supply of dollars in response to domestic conditions, the rest of the world suffers tighter monetary conditions, and when the US expands the supply, the rest of the world enjoys looser conditions, almost regardless of what other nations want or need. Central banks have made their policy goals clear in respect to developing a CBDC. Some central banks look to expand financial inclusion, market access, and their payments system while others are looking to compete with one another (Table 2). Canada, China, and Sweden want to gain a local and international market advantage for their currencies by introducing CBDCs. Table 2CBDC Policy Goals Of Central Banks
Digital Dollar, Will US Policymakers Launch One Soon?
Digital Dollar, Will US Policymakers Launch One Soon?
China Leading CBDC Race, But… At this early stage, China’s digital yuan poses the largest threat to a digital dollar on the international stage. It is the most prominent CBDC project at this current juncture. The digital yuan entered beta testing at the end of 2020 in parts of the country. Wider testing across provinces is being phased in. China’s monetary endeavors began with the Cross-Border Inter-Bank Payment Service in 2015. The digital yuan will be positioned as an extension of this system to promote the national currency and fight global dollar dominance. But how big of a challenge could a digital yuan mount? The answer is not much, not now. China is the world’s largest trading partner but the renminbi accounts for less than 3% of the world’s reserve currency (Chart 5). The disparity between trade and currency status in the global economy reflects a lack of global trust in the renminbi and is a cause for concern for China. China is structurally invested in the dollar-dominated financial system and hence vulnerable to American influence by means of that system. Chart 5Global Renminbi Reserves Are Low
Global Renminbi Reserves Are Low
Global Renminbi Reserves Are Low
The digital yuan would support more debt issuance based on cost and payment incentives to debt holders when financing BRI projects. This will help drive the use of the digital yuan going forward. For example, China can assert its influence over countries with Chinese debt by having them accumulate digital yuan reserves to pay back loans. China can even provide countries with concessions on loans to promote its digital yuan. Concessions on Chinese debt may lead to easier uptake, therefore promoting issuance. If the cost of switching to the digital yuan is low, countries will see no benefit in continuing their trade transactions with China in US dollars. Using the digital yuan as the currency of invoice to disburse loans can make these transactions more transparent and manageable. This could also allow for more state control over funds, an attractive scenario for China. However, China’s monetary ambitions face serious constraints. Lack of trust in the currency is the most critical challenge for internationalization of the yuan, digital or otherwise. Even if the digital yuan project is five to ten years ahead of the curve, countries still opt to hold the dollar over the yuan in any type of crisis, as has been amply demonstrated in history, and over a range of global shocks since 2019. Hence digital yuan adoption will require guarantees from Chinese institutions. But these same institutions have struggled to internationalize the paper renminbi. Lack of openness, transparency, and convertibility are persistent problems. Bottom Line: Central banks around the world are gearing up to introduce CBDCs in coming years. Some are looking to promote financial inclusivity. Others like China’s digital yuan want to chip away at the dollar’s global dominance. Digital versions of fiat currencies will have to demonstrate substantial economic and trade efficiencies in order to encourage diversification away from the US dollar, since there is no inherent reason a digital version of a nation’s currency would increase trust beyond what is already established. But those efficiencies could take shape, which would put pressure on the US to respond. The US faces significant monetary challenges over the long run, including from CBDCs. But the US is a technological power and will eventually respond by developing its own CBDC. Pushback Against A Digital Dollar The Fed has stated that it would only pursue a digital dollar in the context of broad public and cross-governmental support. However, neither the public nor congress broadly support one at present. Public opinion is uneducated on the issue and therefore highly malleable depending on leadership and events. Public Opinion Is Non-Supportive Across age groups, people do not know enough about digital currencies and think it is a bad idea to introduce a digital dollar (Chart 6). A 2020 poll found that only 13% of respondents approved of a digital dollar.5 Low approval is becoming a trend. However, the same poll showed that 38% of respondents think the US dollar is backed by gold, bonds, or oil. Addressing poor monetary literacy among the public would help to improve public support of a digital dollar. US households say they are more likely to trust traditional financial institutions than government agencies to safeguard their personal data (Chart 7). A digital dollar will grant the Fed and federal government far-reaching information regarding the everyday financial transactions of households. Trust in government has been declining and a digital dollar underpinned by a central ledger system would provoke consumer privacy lobby groups and government activists to fight and protest adoption (Chart 8). Chart 6Popular Support For A Digital Dollar Is Lacking
Digital Dollar, Will US Policymakers Launch One Soon?
Digital Dollar, Will US Policymakers Launch One Soon?
Chart 7Households Trust Government Less Than Financial Institutions
Digital Dollar, Will US Policymakers Launch One Soon?
Digital Dollar, Will US Policymakers Launch One Soon?
Chart 8Trust In Government Has Been Waning
Digital Dollar, Will US Policymakers Launch One Soon?
Digital Dollar, Will US Policymakers Launch One Soon?
Chart 9Inflation Outbreak Will Limit Big Government
Digital Dollar, Will US Policymakers Launch One Soon?
Digital Dollar, Will US Policymakers Launch One Soon?
About half of the US public already view the government as “doing too much” (Chart 9). The explosive inflation of 2020-22 will slow the underlying ideological shift to the political left, potentially limiting support for a digital dollar. Public opinion has been shifting for decades in favor of more government involvement in people’s day-to-day lives (Chart 10), but that trend may well stall now that excess of government creates tangible negatives for household pocketbooks (inflation). The bigger of a problem the Fed has in taming inflation in 2022-23, the bigger the political backlash will be. Federal solutions will suffer as a result. This is our theme of “Limited Big Government,” since the role of the state will increase relative to the past 40 years but still within an American context of checks and balances. Chart 10People Have Favored Government Involvement
Digital Dollar, Will US Policymakers Launch One Soon?
Digital Dollar, Will US Policymakers Launch One Soon?
Bottom Line: There is no clear public demand for the digitization of the dollar at present. A major financial or economic disruption stemming from the monetary system or digital assets may be necessary to call public attention to the question. Meanwhile the private sector will drive innovation and the federal government will react to try to maintain domestic stability and international competitiveness. These data support the Fed taking an intermediated approach to cbdc when forced to take action. Policymakers Will Resist Policymakers are divided over the idea of a digital dollar. Senator Ted Cruz introduced a bill in March 2022 to “prohibit the Federal Reserve from offering products or services directly to individuals, maintaining accounts on behalf of individuals, or issuing a central bank digital currency directly to an individual.”6 Cruz has yet to receive widespread party support on the bill but he could get the backing from more GOP members if Republicans take over Congress, as expected, this November. Some Republicans and Democrats have favored cryptocurrencies while others have not, advocating for crypto-mining and crypto start-ups in progressive-left and libertarian right states. But the center-left and center-right might lean more toward cryptocurrency regulation and digital dollar adoption. Coalitions may need to be formed on the topic of a digital dollar, in parties and between parties. A digital dollar will cause a level of disruption, which will affect both the Democrats and Republicans. Government gridlock will create challenges to digital dollar adoption too. The upcoming mid-term elections favor the GOP. Both the House and the Senate are expected to flip in favor of the GOP in 2023. The “Blue Sweep” policy setting will end and only the White House will remain in Democrat control. Republicans have a shot at flipping the White House in 2024, which could see a “Red Sweep.” This scenario may slow adoption of a digital dollar but it will only preclude the unilateral cbdc model, not the intermediated model. The period of 2023-24 is too soon for adoption of a digital dollar anyway but the fact is that gridlock will delay the process until external factors force US action. Bottom Line: Public and political pushback will slow the adoption of a digital dollar. Politicians will need to work along bipartisan lines to ensure the US remains at the forefront of digital and monetary innovation but this will be difficult in a highly polarized country and will likely depend on foreign competition. Investment Takeaways We avoided cryptocurrencies during the irrational exuberance over the past two years. We expect governments to regulate the sector in order to preserve a monopoly over money supply and hence geopolitical interests. With monetary conditions tightening, we expect continued volatility in the crypto space. The US dollar remains strong tactically but is nearing its peak cyclically. We remain long but have put the currency on downgrade watch as the market more fully prices a range of bad news this year. On the global stage, the US dollar will remain the premier reserve currency despite cyclical ups and downs. The current macroeconomic backdrop is negative for the US financial sector (Chart 11). Mergers and acquisitions are drying up while regulatory risks loom. Initial public offerings are also slowing, while trading volume is low. Consumers had already accumulated debt earlier in the cycle and with rising interest rates amid a more challenging job environment, growth in loans and ultimately bank profits will slow. The commercial banking sector faces challenges during the upcoming transitional period of disruptive innovation and regulatory uncertainty. We believe the Fed and policymakers in general will want to cause as little disruption as possible, by integrating any digital dollar with the traditional finance sector as seamlessly as possible. However, transitions, especially those digital in nature, bring with them high uncertainty in the financial sector and elsewhere. Chart 11Financial Sector Facing Macro Headwinds
Financial Sector Facing Macro Headwinds
Financial Sector Facing Macro Headwinds
Guy Russell Senior Analyst guyr@bcaresearch.com Footnotes 1 Stablecoins are backed by various assets and means. Fiat money, commodities, other cryptocurrencies and by algorithmic means are some examples. 2 See The Bank For International Settlements, Central Bank Digital Currencies: Executive Summary, September 2021, bis.org. 3 See The Board of Governors of the Federal Reserve System, Money and Payments: The U.S.Dollar in the Age of Digital Transformation, January 2022, federalreserve.gov. 4 See U.S. Department Of The Treasury, Remarks from Secretary of the Treasury Janet L. Yellen on Digital Assets, April 2022, treasury.gov. 5 See Cointelegraph, Most Americans are against a digital dollar CBDC, survey reveals,september 25, 2020, cointelegraph.com 6 See Ted Cruz’s Proposed Bill to amend the Federal Reserve Act to prohibit the Federal reserve banks from offering certain products or services directly to an individual, and for other purposes, March 2022, cruz.senate.gov. Strategic View Open Tactical Positions (0-6 Months) Open Cyclical Recommendations (6-18 Months) Table A2Political Risk Matrix
Digital Dollar, Will US Policymakers Launch One Soon?
Digital Dollar, Will US Policymakers Launch One Soon?
Table A3US Political Capital Index
Digital Dollar, Will US Policymakers Launch One Soon?
Digital Dollar, Will US Policymakers Launch One Soon?
Chart A1Presidential Election Model
Third Quarter US Political Outlook: Last Ditch Effort
Third Quarter US Political Outlook: Last Ditch Effort
Chart A2Senate Election Model
Third Quarter US Political Outlook: Last Ditch Effort
Third Quarter US Political Outlook: Last Ditch Effort
Table A4House Election Model
Will Trump Run Again? What About Biden?
Will Trump Run Again? What About Biden?
Table A5APolitical Capital: White House And Congress
Digital Dollar, Will US Policymakers Launch One Soon?
Digital Dollar, Will US Policymakers Launch One Soon?
Table A5BPolitical Capital: Household And Business Sentiment
Digital Dollar, Will US Policymakers Launch One Soon?
Digital Dollar, Will US Policymakers Launch One Soon?
Table A5CPolitical Capital: The Economy And Markets
Digital Dollar, Will US Policymakers Launch One Soon?
Digital Dollar, Will US Policymakers Launch One Soon?
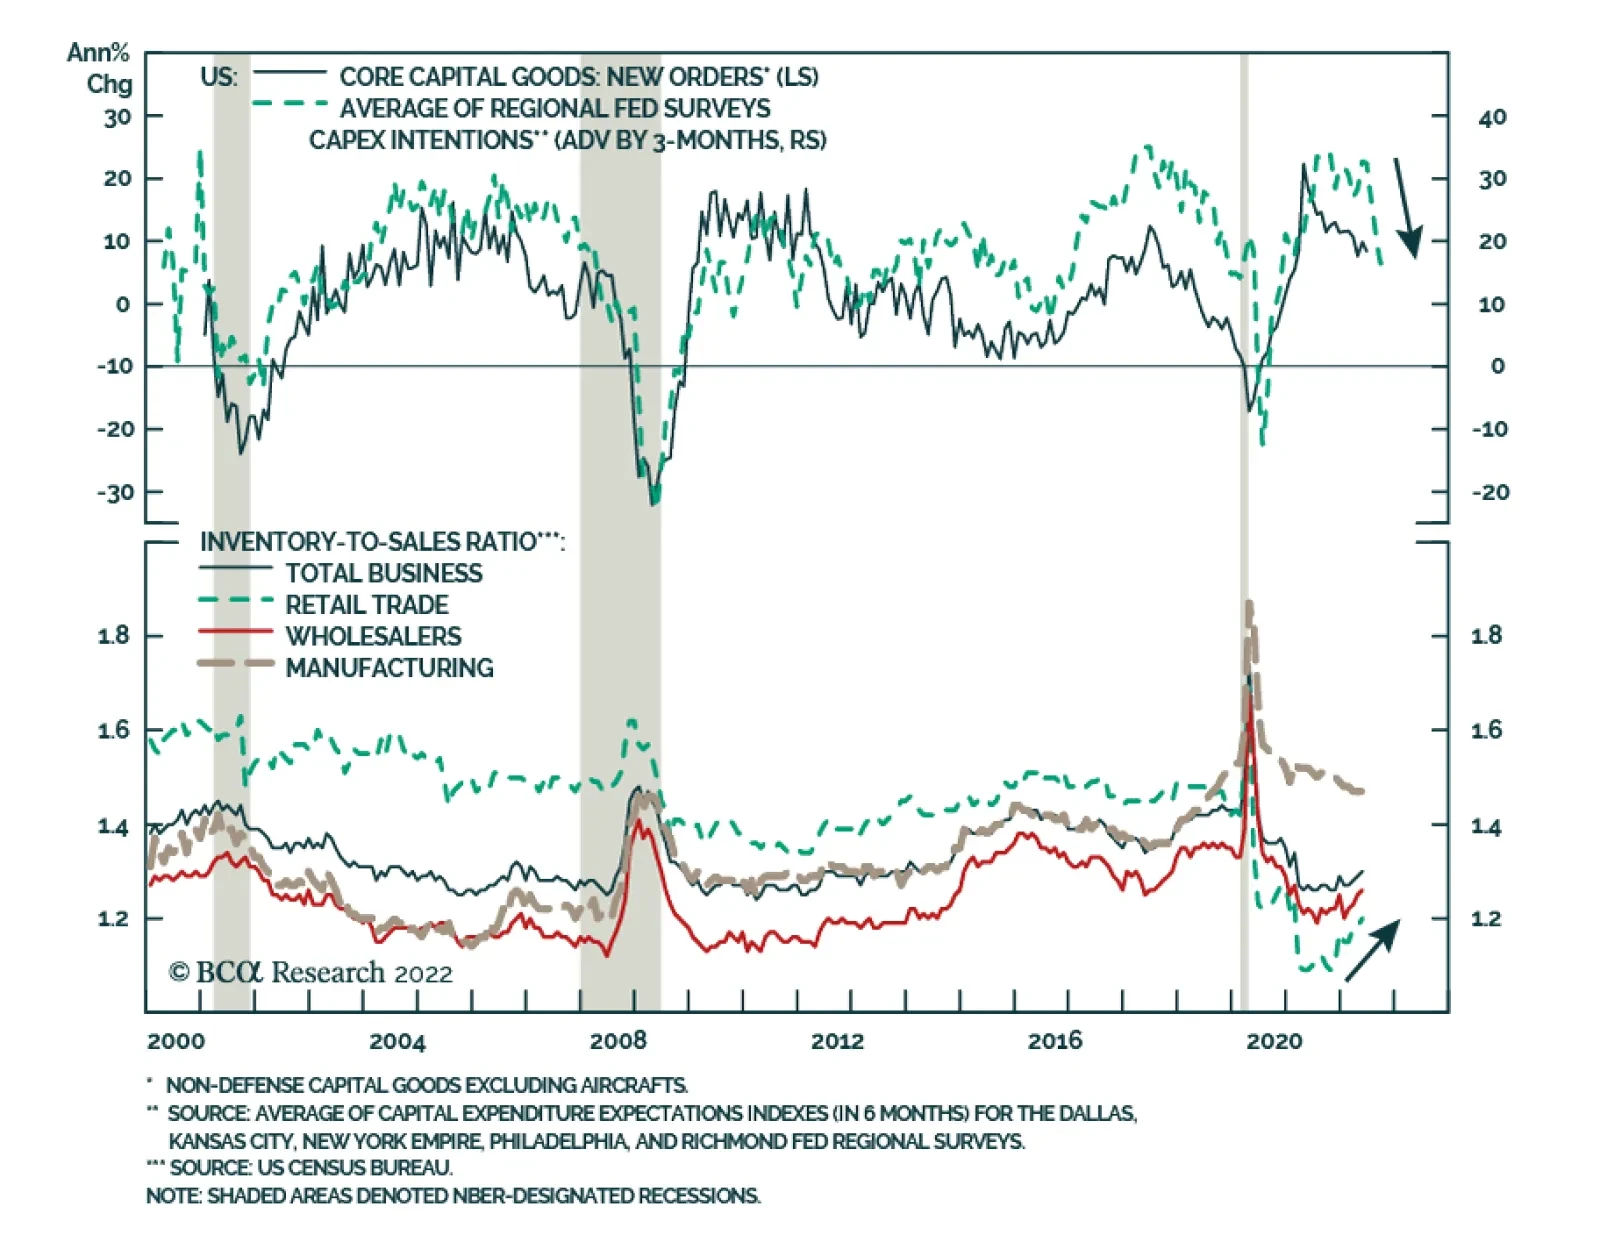
Preliminary estimates indicate that US durable goods orders unexpectedly firmed in June, accelerating from 0.8% m/m to 1.9% m/m and surprising expectations they would contract. However, the underlying details of this seemingly positive headline figure…
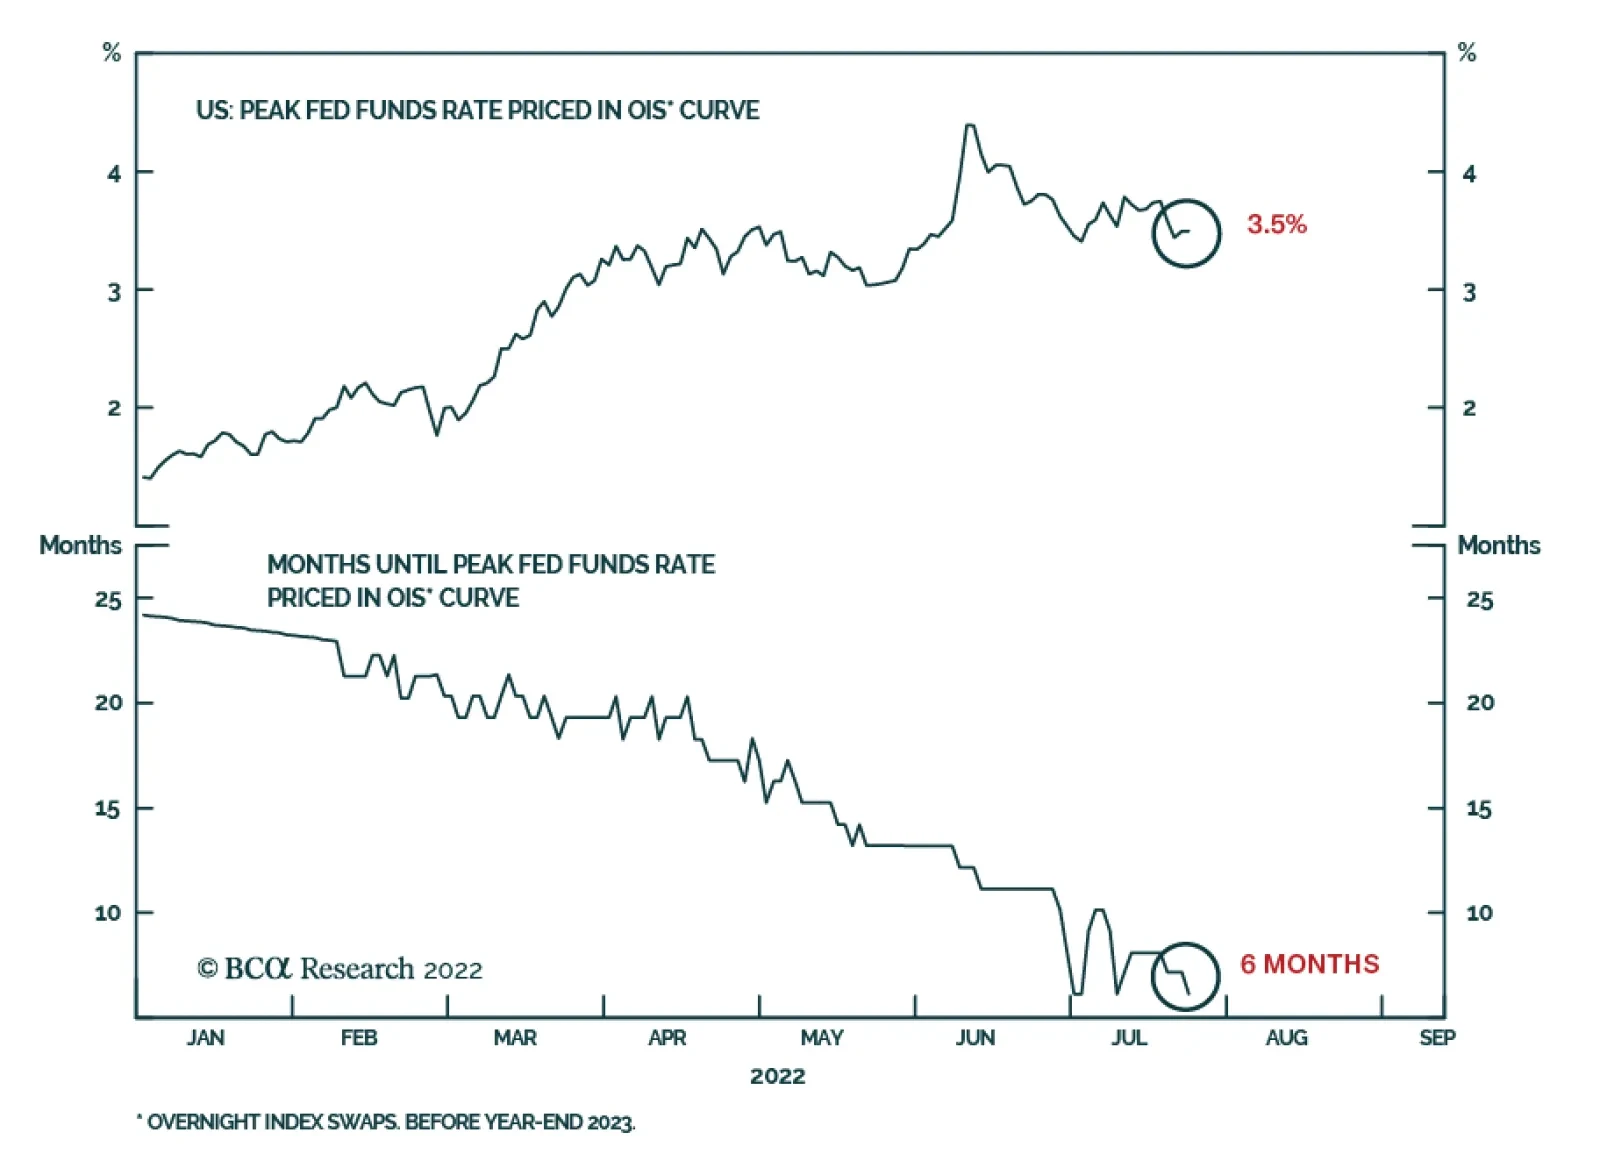
As expected, the Fed delivered another “unusually large” 75bp rate hike on Thursday to combat persistent inflationary pressures. Although the central bank acknowledged that spending and activity indicators have softened recently, it also highlighted that the…
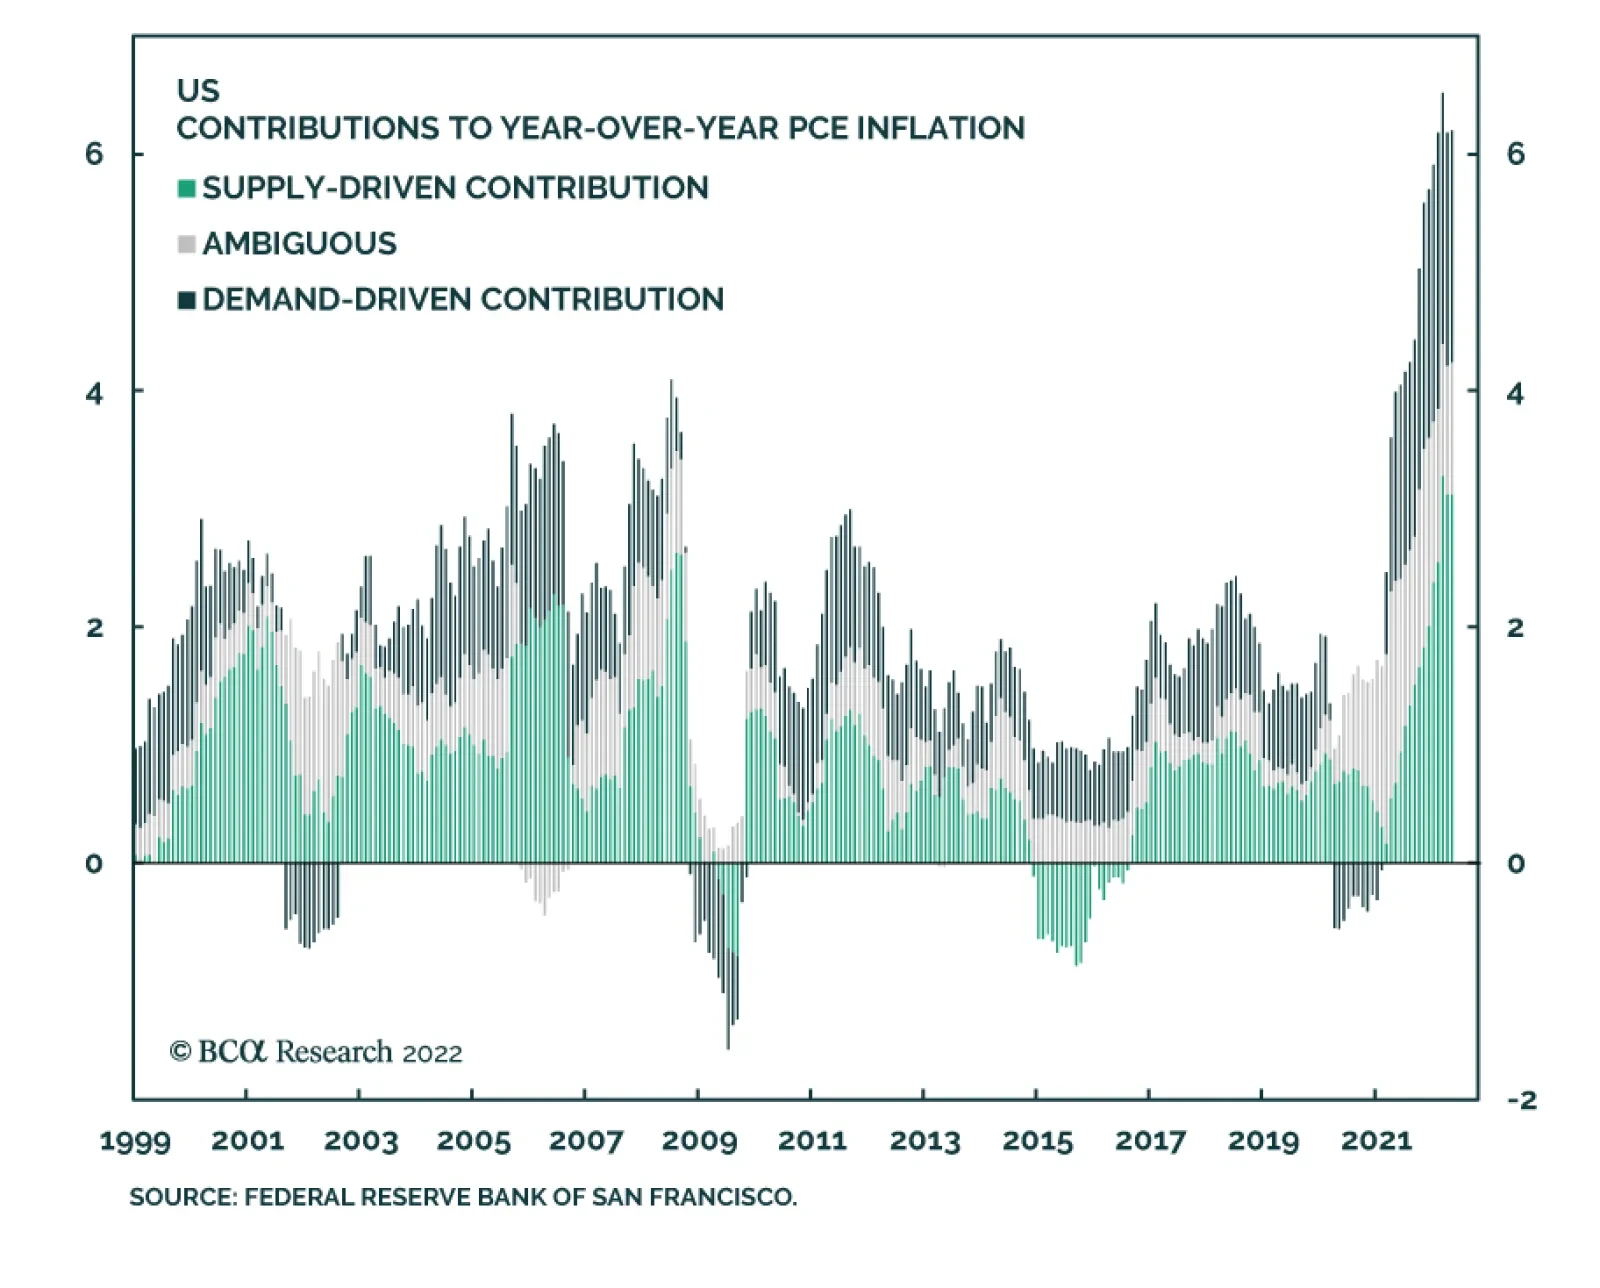
The Federal Reserve Bank of San Francisco estimates that about half of the inflationary pressures this year resulted from supply-side dislocations. The implication is that going forward, a normalization of economic activity and supply chains will…
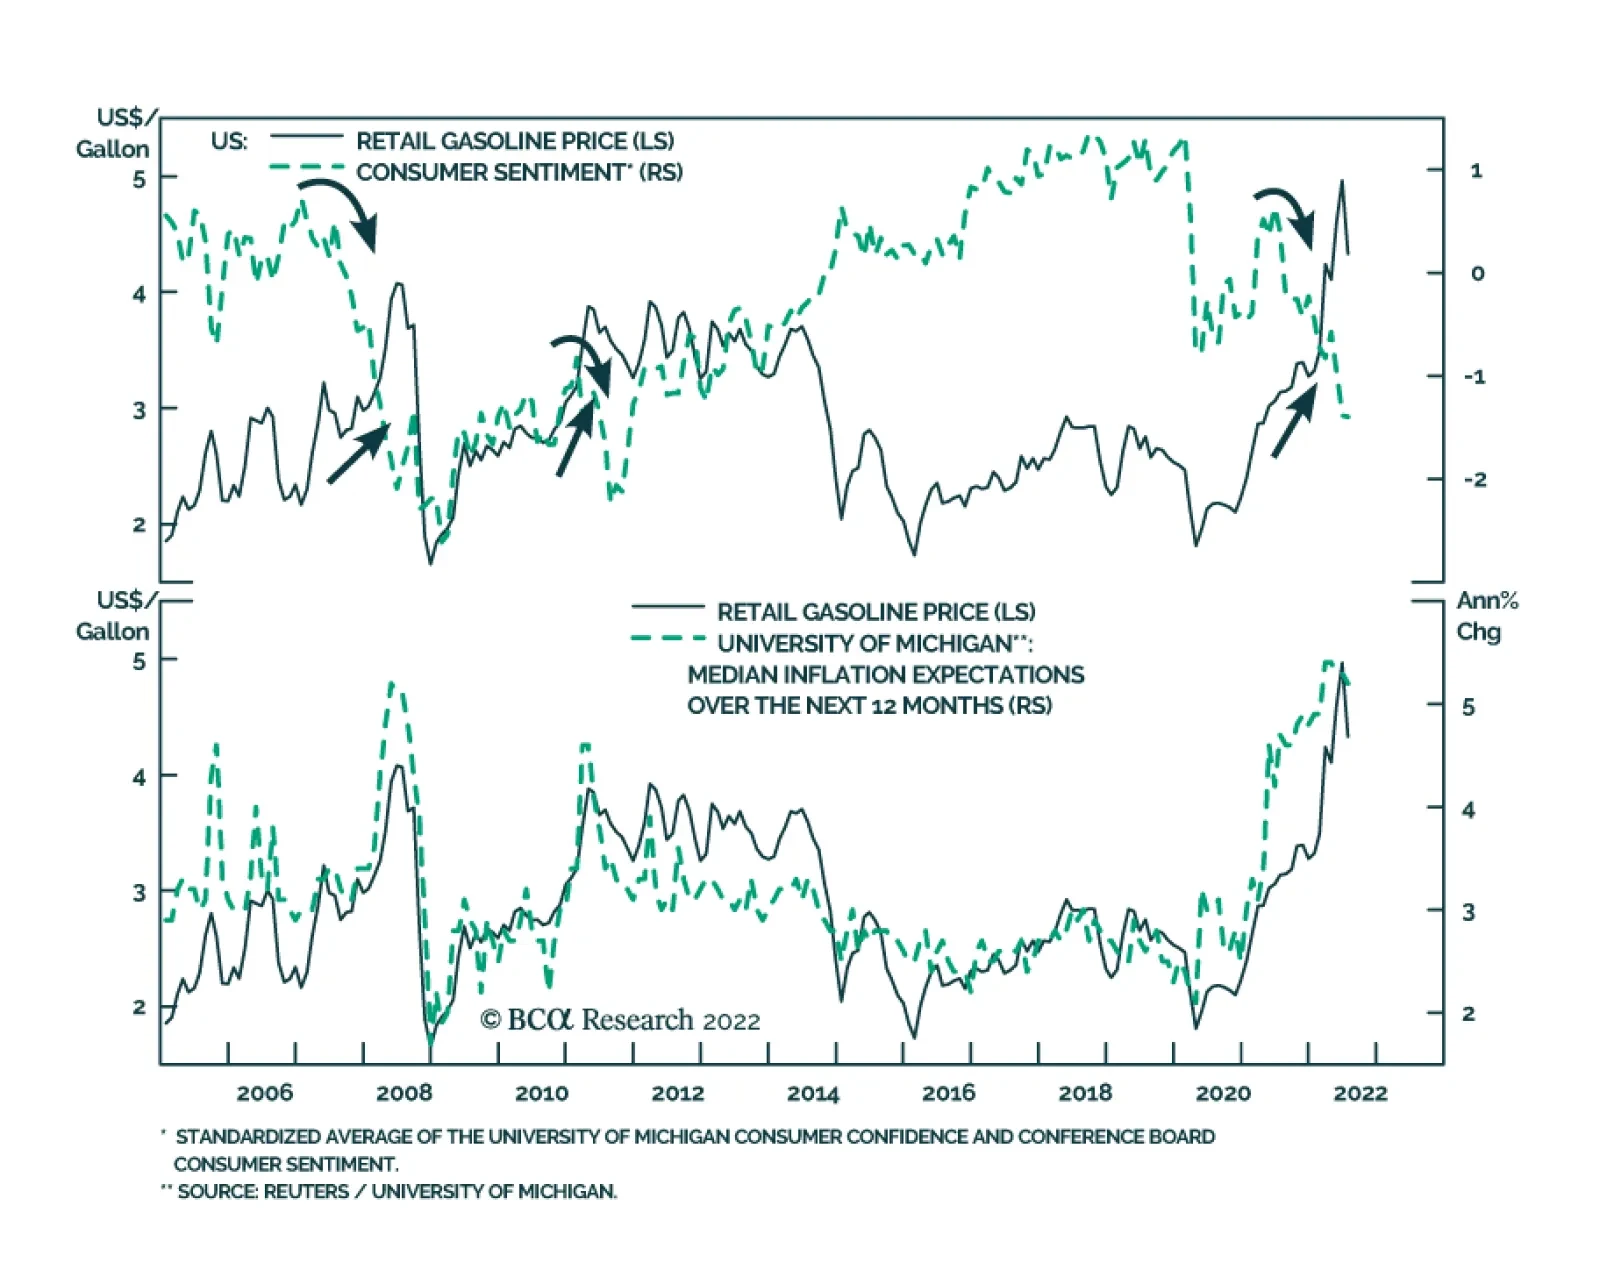
The top panel of the chart above highlights that the relationship between gasoline prices and consumer sentiment is not stable. The correlation between gas prices and sentiment is typically positive. This is not surprising: improving economic conditions…
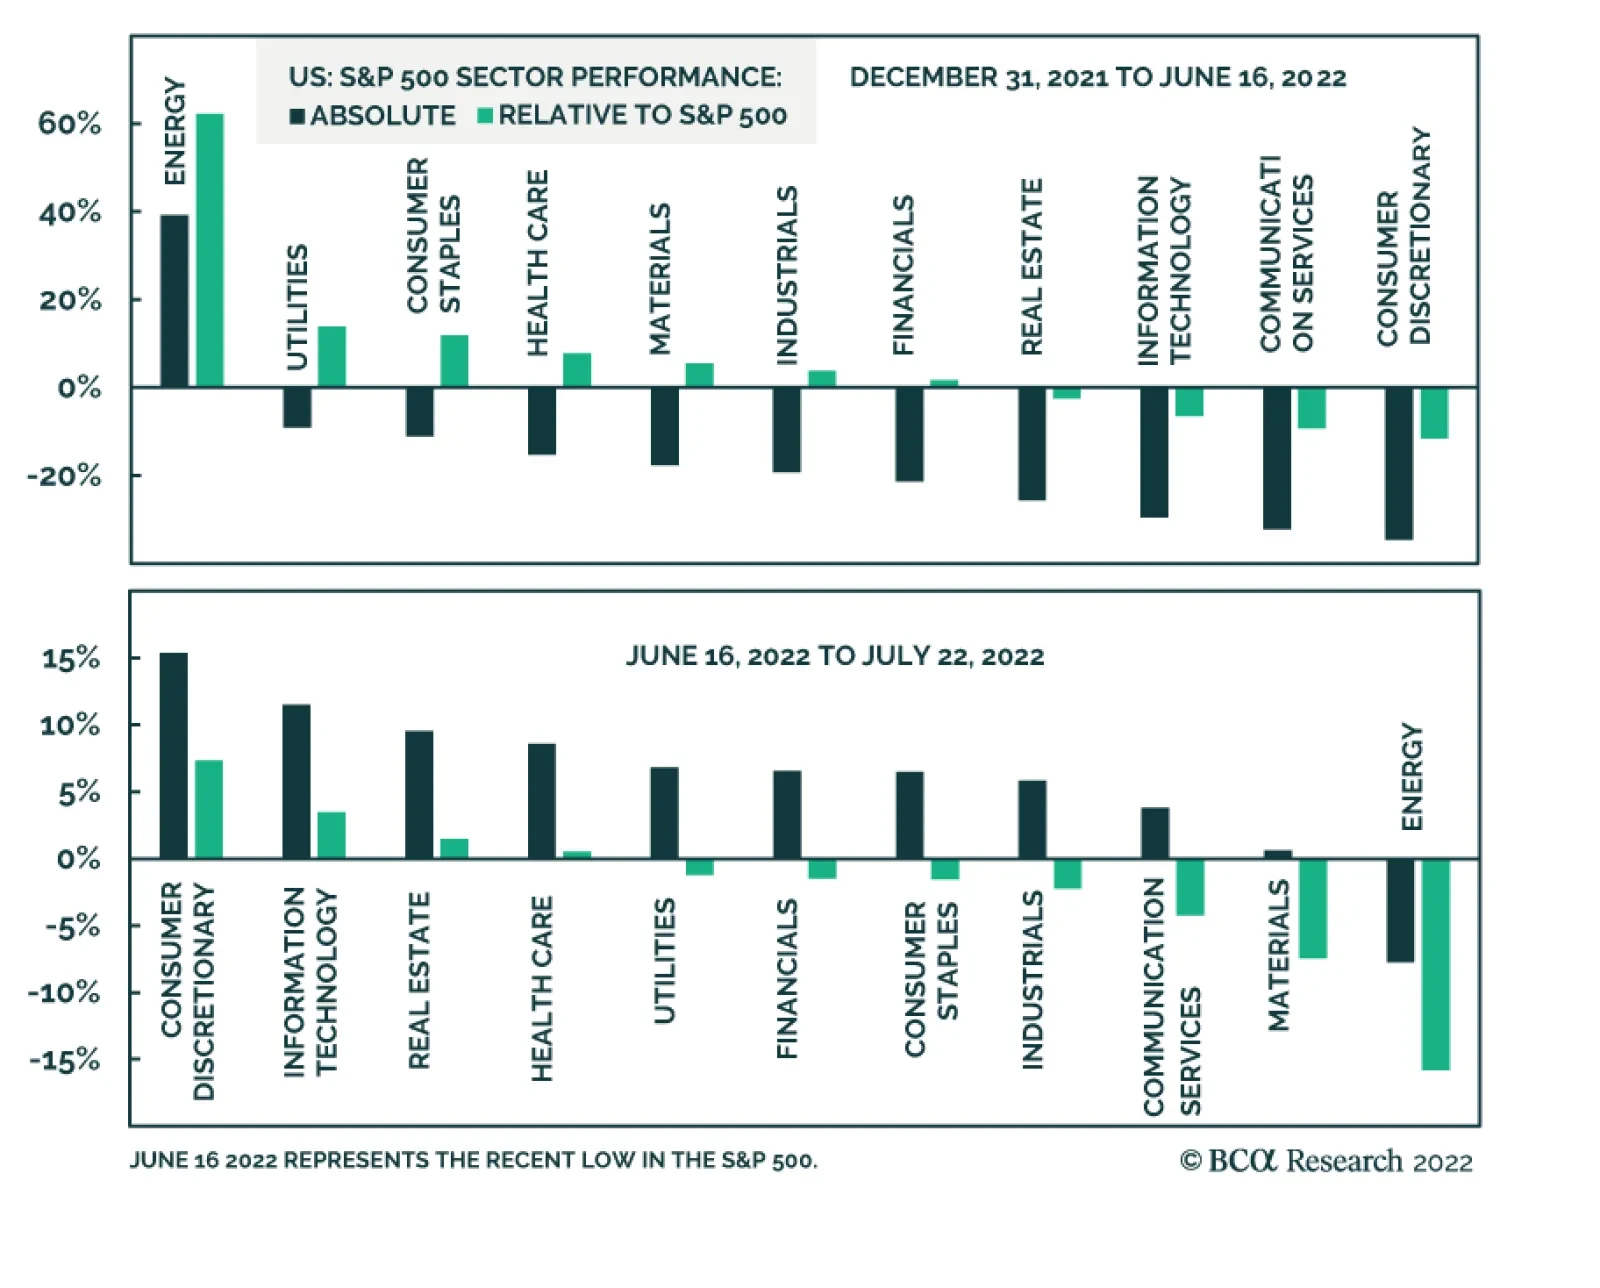
This year’s US equity selloff has been broad-based. Energy is the only S&P 500 sector that has posted year-to-date gains. The indiscriminate nature of the slump highlights that macro forces are behind the weakness. The Fed’s abrupt hawkish pivot has…