United States
This year’s US equity selloff has been broad-based. Energy is the only S&P 500 sector that has posted year-to-date gains. The indiscriminate nature of the slump highlights that macro forces are behind the weakness. The Fed’s abrupt hawkish pivot has…
According to BCA Research’s US Bond Strategy service, the peak fed funds rate that is currently priced in the market for 2023 is too low, and the funds rate will also likely peak later than what is priced in the curve. To make sense of all the different…

Executive Summary Peak Fed Funds?
Peak Fed Funds?
Peak Fed Funds?
The bond market is priced for a fed funds rate that will peak in February 2023 at 3.44% before trending down. We survey several interest rate cycle indicators and conclude that the market’s expected peak is too low and occurs too early. These indicators include: the unemployment rate, financial conditions, PMIs, the yield curve and housing starts. We also update our default rate forecast and are now looking for the default rate to rise to between 4.7% and 5.9% during the next 12 months. While our default rate forecasts imply a reasonably attractive 12-month junk bond valuation, we hesitate to turn too bullish on high-yield given that the next peak in the default rate is still not in sight. Bottom Line: We recommend keeping portfolio duration close to benchmark for the time being, though we will be looking for opportunities to reduce duration in the second half of this year. Similarly, we recommend a neutral (3 out of 5) allocation to junk bonds but will recommend reducing exposure if spreads rally back to average 2017-19 levels. Feature Last week’s report presented three conjectures about the US economy.1 One of those was that a recession will be required to get inflation back to 2%. But when will that recession occur? The question of timing is a vital one for bond investors. Are we on the cusp of recession right now? If so, then bond investors should extend portfolio duration in anticipation of Fed rate cuts and a return to 2% inflation. Conversely, if the recession is delayed, interest rates probably move higher before the cycle ends and investors should consider reducing portfolio duration. This week’s report addresses the topic of timing the next recession and discusses the implications for bond portfolio construction. Timing The Interest Rate Cycle From a bond market perspective, the question of whether the economy is in recession is less important than whether the Fed is hiking or cutting rates. Therefore, for the purposes of this report we will define a “recession” as an economic slowdown that is significant enough for the Fed to start cutting interest rates. Chart 1Peak Fed Funds?
Peak Fed Funds?
Peak Fed Funds?
Now, let’s start by looking at what sort of interest rate cycle is priced in the market. The overnight index swap curve is currently discounting a peak fed funds rate of 3.44% (Chart 1). It is also priced for that peak to occur in 7 months, or by February 2023 (Chart 1, bottom panel). As bond investors, the question we must ask is whether this pricing seems reasonable. To do so, we will perform a survey of different indicators that have strong track records of sending signals near the peaks of interest rate cycles. Unemployment The first indicator we’ll look at is the unemployment rate. Economist Claudia Sahm has shown that a recession always occurs when the 3-month moving average of the unemployment rate rises to 0.5% above its trailing 12-month minimum.2 Table 1 dispenses with the moving average and simply shows the deviation of the unemployment rate from its trailing 12-month minimum on the dates of first Fed rate cuts since 1990. We see that the Fed has typically started to cut rates once the unemployment rate is 0.3-0.4 percentage points off its low. The exception is 2019 when the unemployment rate was only 0.1% off its low, but when inflation was below the Fed’s 2% target. Table 1Unemployment And Inflation When The Fed Starts Easing
Recession Now Or Recession Later?
Recession Now Or Recession Later?
At 3.6%, the unemployment rate is currently at its cycle low. Based on the numbers shown in Table 1, this means that we should only expect the Fed to cut interest rates if the unemployment rises to at least 3.9% or 4.0%. We say “at least” because it’s also important to note that the inflation picture is a lot different today than it was during the periods shown in Table 1. With inflation so much higher, it is reasonable to think that the Fed will tolerate a greater increase in the unemployment rate before pivoting to rate cuts. Looking ahead, initial unemployment claims appear to have bottomed for the cycle and changes in initial claims are highly correlated with changes in the unemployment rate (Chart 2). That said, the trend in claims is currently consistent with a leveling-off of the unemployment rate, not a large increase. Financial Conditions Second, we turn to financial conditions. Fed officials often assert that monetary policy works through its impact on broad financial conditions. Therefore, it’s not too surprising that rate cuts tend to occur only after the Goldman Sachs Financial Conditions Index has moved into restrictive territory. Currently, despite the Fed’s dramatic hawkish shift, the index still shows financial conditions to be accommodative (Chart 3). Chart 2Jobless Claims Moving Higher
Jobless Claims Moving Higher
Jobless Claims Moving Higher
Chart 3Financial Conditions
Financial Conditions
Financial Conditions
The same caveat we applied to the unemployment rate applies to financial conditions. As long as inflation is above the Fed’s target, it’s highly likely that the Fed will be comfortable with financial conditions that are somewhat restrictive. Therefore, the Fed may not pivot as soon as the Goldman Sachs index moves above 100, as has been the pattern in the recent past. Yield Curve Third, we note that an inverted Treasury curve almost always precedes the start of a Fed rate cut cycle, and the Treasury curve is certainly inverted today (Chart 4). The logic behind this indicator is somewhat circular in the sense that an inverted Treasury curve simply tells us that the market anticipates Fed rate cuts. If data emerge to suggest that Fed rate cuts will be postponed, then the Treasury curve could re-steepen. It’s for this reason that the Treasury curve often inverts well in advance of an economic recession and Fed rate cuts. We explored the relationship in more detail in a recent Special Report.3 Chart 4Interest Rate Cycle Indicators
Interest Rate Cycle Indicators
Interest Rate Cycle Indicators
Chart 5Manufacturing PMIs
Manufacturing PMIs
Manufacturing PMIs
PMIs Typically, the ISM Manufacturing PMI is below 50 by the time of the first Fed rate cut (Chart 4, panel 3). Currently, the ISM Manufacturing PMI is a healthy 53.0, but it has been falling quickly and trends in regional PMI surveys suggest that it will dip below 50 within the next few months (Chart 5). Interestingly, both the ISM and regional PMI surveys show that manufacturing supplier delivery times have come down a lot (Chart 5, panel 2). This gives some hope that goods inflation will trend lower during the next few months, as is our expectation. Recently, there’s also been an unusual divergence between the employment components of the ISM and regional Fed surveys. The New York and Philadelphia Fed surveys are showing strength in their employment components. Meanwhile, the ISM employment figure is below 50 (Chart 5, bottom panel). This divergence likely boils down to labor shortages that complicate how firms are responding to the employment question in the surveys. For example, despite the sub-50 employment figure, the latest ISM release noted that “an overwhelming majority of panelists […] indicate that their companies are hiring.”4 Housing In a recent report, we developed a rule of thumb that says that Fed rate cuts typically don’t occur until after the 12-month moving average of housing starts falls below the 24-month moving average.5 That indicator is coming down, but it still has a lot of breathing room before it dips into negative territory (Chart 4, bottom panel). That same report also outlined that we see the housing market slowdown proceeding in three stages. First, higher mortgage rates will suppress housing demand. This is already happening at a rapid pace as indicated by trends in mortgage purchase applications and existing home sales (Chart 6A). Second, lower housing demand will push up inventories and send prices lower. This has not yet shown up in the data (Chart 6B). Finally, once lower prices and higher inventories sufficiently disincentivize construction, we will see a marked deterioration in housing starts. Currently we see that housing starts have dipped, and homebuilder confidence has plummeted, but starts still haven’t decisively broken their uptrend (Chart 6C). Chart 6AHousing Demand
Housing Demand
Housing Demand
Chart 6BPrices & Inventories
Prices & Inventories
Prices & Inventories
Chart 6CBuilding Activity
Building Activity
Building Activity
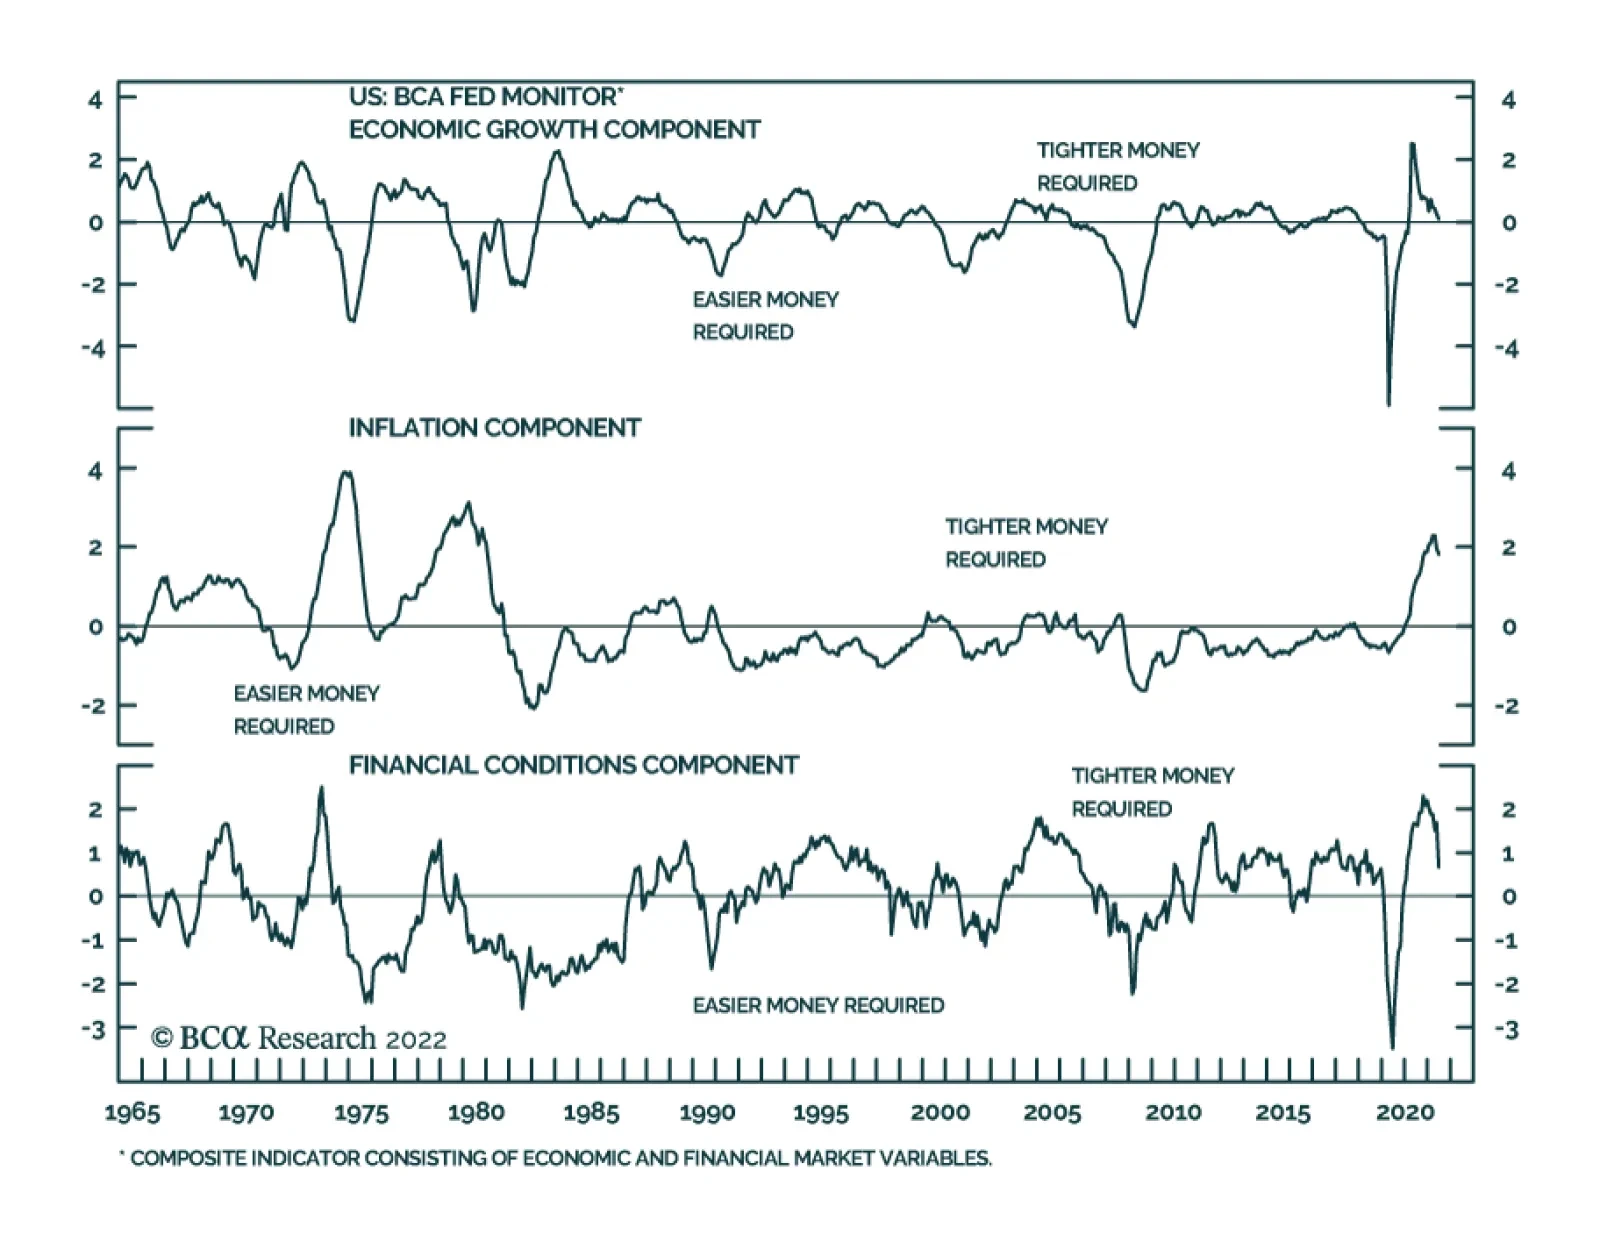
Putting It All Together To make sense of all the different indicators that could signal a Fed pivot toward rate cuts, we turn to our Fed Monitor. The Fed Monitor is a composite indicator that includes many of the individual indicators we have already examined in this report, as well as some others. The Fed Monitor is constructed so that a positive reading suggests that the Fed should be hiking rates and a negative reading suggests the Fed should be cutting rates. As can be seen in Chart 7, the Monitor is currently deep in positive territory. Chart 7Fed Monitor Calls For Tighter Money
Fed Monitor Calls For Tighter Money
Fed Monitor Calls For Tighter Money
The Fed Monitor consists of three main sub-components, an economic growth component, an inflation component and a financial conditions component (Chart 7, bottom 3 panels). We see that the economic growth component of the Monitor is consistent with a neutral Fed policy stance – neither hikes nor cuts - and financial conditions point to a mildly restrictive stance. However, unsurprisingly, the inflation component is the highest it has been since the early-1980s and this is applying a ton of upward pressure to the Monitor. While our Fed Monitor is not a perfect indicator, it does speak to the tradeoff between inflation and economic growth that we have already hinted at in this report. Specifically, the Monitor illustrates that as long as inflation remains elevated it will take a significant deterioration in economic growth and financial conditions before the overall Monitor recommends a dovish Fed pivot. To us, this argues for a higher and later peak in the fed funds rate than is currently priced in the curve. Bottom Line: The peak fed funds rate that is currently priced in the market for 2023 is too low, and the funds rate will also likely peak later than what is priced in the curve. That said, falling inflation and economic growth concerns will probably keep a lid on bond yields during the next few months. We advise investors to keep portfolio duration close to benchmark for the time being, but to look for opportunities to reduce exposure. We will consider reducing our recommended portfolio duration stance to ‘below-benchmark’ if the 10-year Treasury yield falls to 2.5% or if core inflation reverts to our estimate of its 4%-5% underlying trend. Timing The Default Rate Cycle The interest rate cycle is not the only important one for bond investors. The default rate cycle is also crucial for spread product allocations because default trends are responsible for a significant amount of the volatility in corporate bond spreads. In this section we consider the outlook for corporate defaults and high-yield bond performance. We model the trailing 12-month speculative grade default rate using gross leverage (total debt over pre-tax profits) and C&I lending standards (Chart 8). Conservatively, if we assume 5% corporate debt growth for the next 12 months and corporate profit growth of between -10% and -20%, our model projects that the default rate will rise to between 4.7% and 5.9% (Chart 8, top panel). It’s notable that, like us, banks are also preparing for an increase in corporate defaults by raising their loan loss provisions (Chart 8, panel 2). Meanwhile, job cut announcements – another reliable indicator of corporate defaults – still don’t point to a higher default rate (Chart 8, bottom panel). Chart 8The Default Rate Has Troughed
The Default Rate Has Troughed
The Default Rate Has Troughed
Interestingly, our model’s conservative projections suggest that in 12 months the default rate will be lower than its typical recession peak. Given today’s cheap junk valuations, this sort of analysis is encouraging a lot of people to turn bullish on high-yield bonds. Chart 9Default-Adjusted Spread
Default-Adjusted Spread
Default-Adjusted Spread
This line of reasoning is not totally unfounded. Using the same forecasted default rate scenarios from Chart 8 along with an assumed 40% recovery rate on defaulted debt, we calculate that the excess spread available in the junk index after subtracting 12-month default losses is between 136 bps and 208 bps. This is below the historical average (Chart 9), but still above the 100 bps threshold that often delineates between junk bond outperformance and underperformance versus duration-matched Treasuries.6 More specifically, Chart 10 shows the relationship between our default-adjusted spread and high-yield excess returns versus Treasuries for each calendar year going back to 1995. We see that, in general, there is a positive relationship between spread and returns and that excess returns are more often positive than negative whenever the default-adjusted spread is above 100 bps. However, Chart 10 also shows periods when a pure analysis of junk bond performance based on the 12-month default-adjusted spread didn’t pan out. The year 2008 is a prime example. The default-adjusted spread came in at 249 bps for 2008, above the historical average. However, junk spreads widened dramatically in 2008 and excess returns were dismal. Chart 10The Default-Adjusted Spread And High-Yield Returns
Recession Now Or Recession Later?
Recession Now Or Recession Later?
The reason the default-adjusted spread valuation framework failed in 2008 is that while the default rate only moved up to 4.9% in 2008, it wasn’t done increasing for the cycle. In fact, the rise in the default rate accelerated in 2009 until it hit 14.6% in November of that year. So, while default losses were low compared to the starting index spread in 2008, junk index spreads widened sharply in 2008 as the market prepared for worse default losses in 2009. The lesson we draw from the 2008 example is that even if the junk bond market is attractively priced relative to expected default losses on a 12-month horizon, unless we can forecast a peak in the default rate it is unwise to be overly bullish on high-yield bonds. Even if a recession doesn’t occur within the next 6-12 months, it will likely occur within the next 12-24 months. In that environment, investors are unlikely to realize the full potential of today’s attractive 12-month junk bond valuations. Chart 11Junk Spreads
Junk Spreads
Junk Spreads
The bottom line is that we maintain a neutral (3 out of 5) allocation to high-yield within US fixed income portfolios for now. Junk spreads are elevated compared to past rate hike cycles and could tighten during the next few months as inflation converges to its underlying 4%-5% trend. That said, we will not turn outright bullish on junk bonds until we can reasonably forecast a peak in the default rate. In the meantime, a sell on strength strategy is more appropriate. We will reduce our recommended allocation to high-yield bonds if the average index spread tightens to its average 2017-19 level (Chart 11) or once inflation converges with its underlying 4%-5% trend. Ryan Swift US Bond Strategist rswift@bcaresearch.com Footnotes 1 Please see US Bond Strategy Weekly Report, “Three Conjectures About The US Economy”, dated July 19, 2022. 2 https://www.hamiltonproject.org/assets/files/Sahm_web_20190506.pdf 3 Please see US Bond Strategy / US Investment Strategy / US Equity Strategy Special Report, “The Yield Curve As An Indicator”, dated March 29, 2022. 4 https://www.ismworld.org/supply-management-news-and-reports/reports/ism… 5 Please see US Bond Strategy Weekly Report, “The Bond Market Implications Of A 5% Mortgage Rate”, dated April 26, 2022. 6 For a more complete analysis of the link between the default-adjusted spread and excess high-yield returns please see US Bond Strategy / Global Fixed Income Strategy Special Report, “Turning Defensive On US Corporate Bonds,” dated April 12, 2022. Recommended Portfolio Specification Other Recommendations Treasury Index Returns Spread Product Returns
The ongoing normalization of consumption patterns is one of the factors responsible for deteriorating global manufacturing activity (see Market Focus). The pandemic binge has satiated Americans’ demand for goods (excluding autos). The global manufacturing…
Soaring price pressures and tight labor market conditions – characterized by the difficulty employers are facing in finding qualified workers – are a recipe for robust wage growth (see Country Focus). With labor costs accounting for over 50% of sales…
Executive Summary More Tightening To Come
More Tightening To Come
More Tightening To Come
In the following report we answer the most asked questions from our recent “Bear Market 2.0” webcast. Macroeconomic backdrop and inflation: While commodity prices falling, the wage-price spiral is in full force, implying that it will take many months to reach the level of PCE inflation palatable to the Fed. The Fed will continue to tighten monetary conditions until entrenched inflation reaches its target, which may take longer than the market expects. Earnings outlook: Q2-2022 results show that an earnings slowdown has already commenced and is bound to get worse over the next couple of quarters. However, earnings forecasts are still too optimistic and a slowdown in earnings growth is not yet priced in. Investment themes: We recommend topping up allocation to Tech as it benefits from rate stabilization. However, be judicious in your choices, staying away from the more cyclical areas, such as Hardware and Equipment, and Semiconductors. We are overweight Software and Services, which is dominated by profitable and stable growth companies. Bottom Line: We continue to recommend that investors remain patient and prudent in range-bound markets. Earnings growth is likely to deteriorate into the year end. Feature Last Monday, July 18, I hosted a webcast called “Bear Market 2.0.” A total of 675 people dialed in, and I was honored. The webcast generated a significant number of client questions which I aim to address in this weekly publication. Broadly speaking, questions fell under each of the three rubrics of the webcast: Macroeconomic backdrop, earnings outlook, and investment themes, with the latter generating the lion’s share of questions. In today’s report, we will discuss inflation and rates, earnings season results, potential S&P 500 targets, whether the S&P 500 rally is sustainable, and if it is a good idea to top up Tech. We will address remaining questions on Energy and Materials, and Semiconductor in the near future. And as always, we are looking forward to more questions! Macroeconomic Backdrop How do you reconcile your inflation outlook with an assumption that long yields may have peaked? In the “Fat and Flat” and “Adaptive Expectations” reports, we outline our view that the market’s focus is shifting away from concerns about inflation and the hawkish Fed toward worries about growth. Indeed, the 10-year rate has stabilized at 2.78% on fears of impending slowdown (Chart 1). How does this reconcile with our view that inflation is entrenched and broadening (Chart 2), especially in light of the recent pullback in energy and commodities prices? Chart 1Yields Are Stabilizing
Yields Are Stabilizing
Yields Are Stabilizing
Chart 2Inflation Is Entrenched
Inflation Is Entrenched
Inflation Is Entrenched
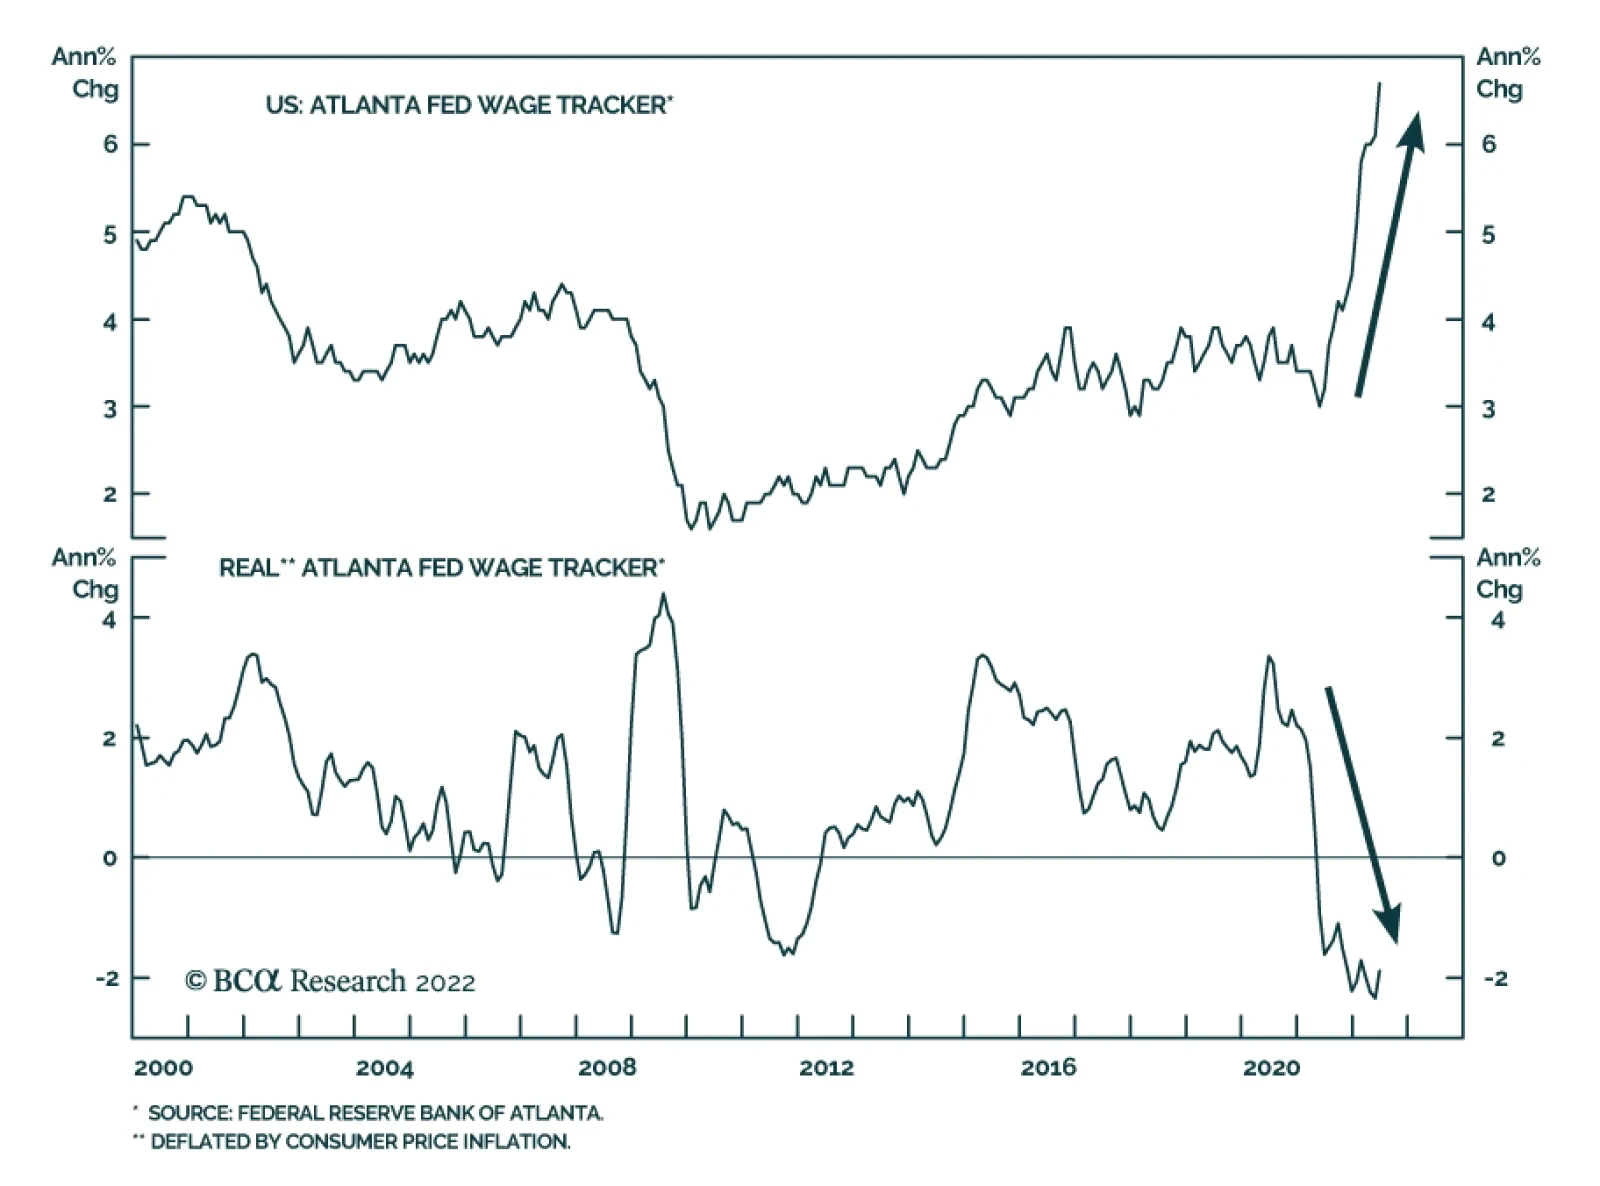
Even if energy and commodities prices are falling, the latest wage survey from the Atlanta Fed demonstrates wage growth is not letting up, and labor costs, at over 50% of sales as per NIPA accounts, are a more important component of the US corporate cost structure than the cost of energy. Inflation is embedded as, companies pass on wage increases to customers by increasing prices – and, voilà, the wage-price spiral is becoming pervasive. This dynamic implies the following: Even if inflation peaks over the next several months, it will take many months to reach the level of PCE inflation palatable to the Fed. After having mismanaged inflation over the past 18 months, the Fed will err on the side of tighter policy. In fact, in its official statement, the Fed has asserted that its commitment to bringing inflation to its 2% target is unconditional. Therefore, we are still in the early innings of the monetary tightening cycle (Chart 3), where elevated inflation coexists with slowing growth and range-bound long rates. Bottom Line: The Fed will continue to tighten monetary conditions until entrenched inflation reaches its target, which may take longer than the market expects. Chart 3More Tightening To Come
More Tightening To Come
More Tightening To Come
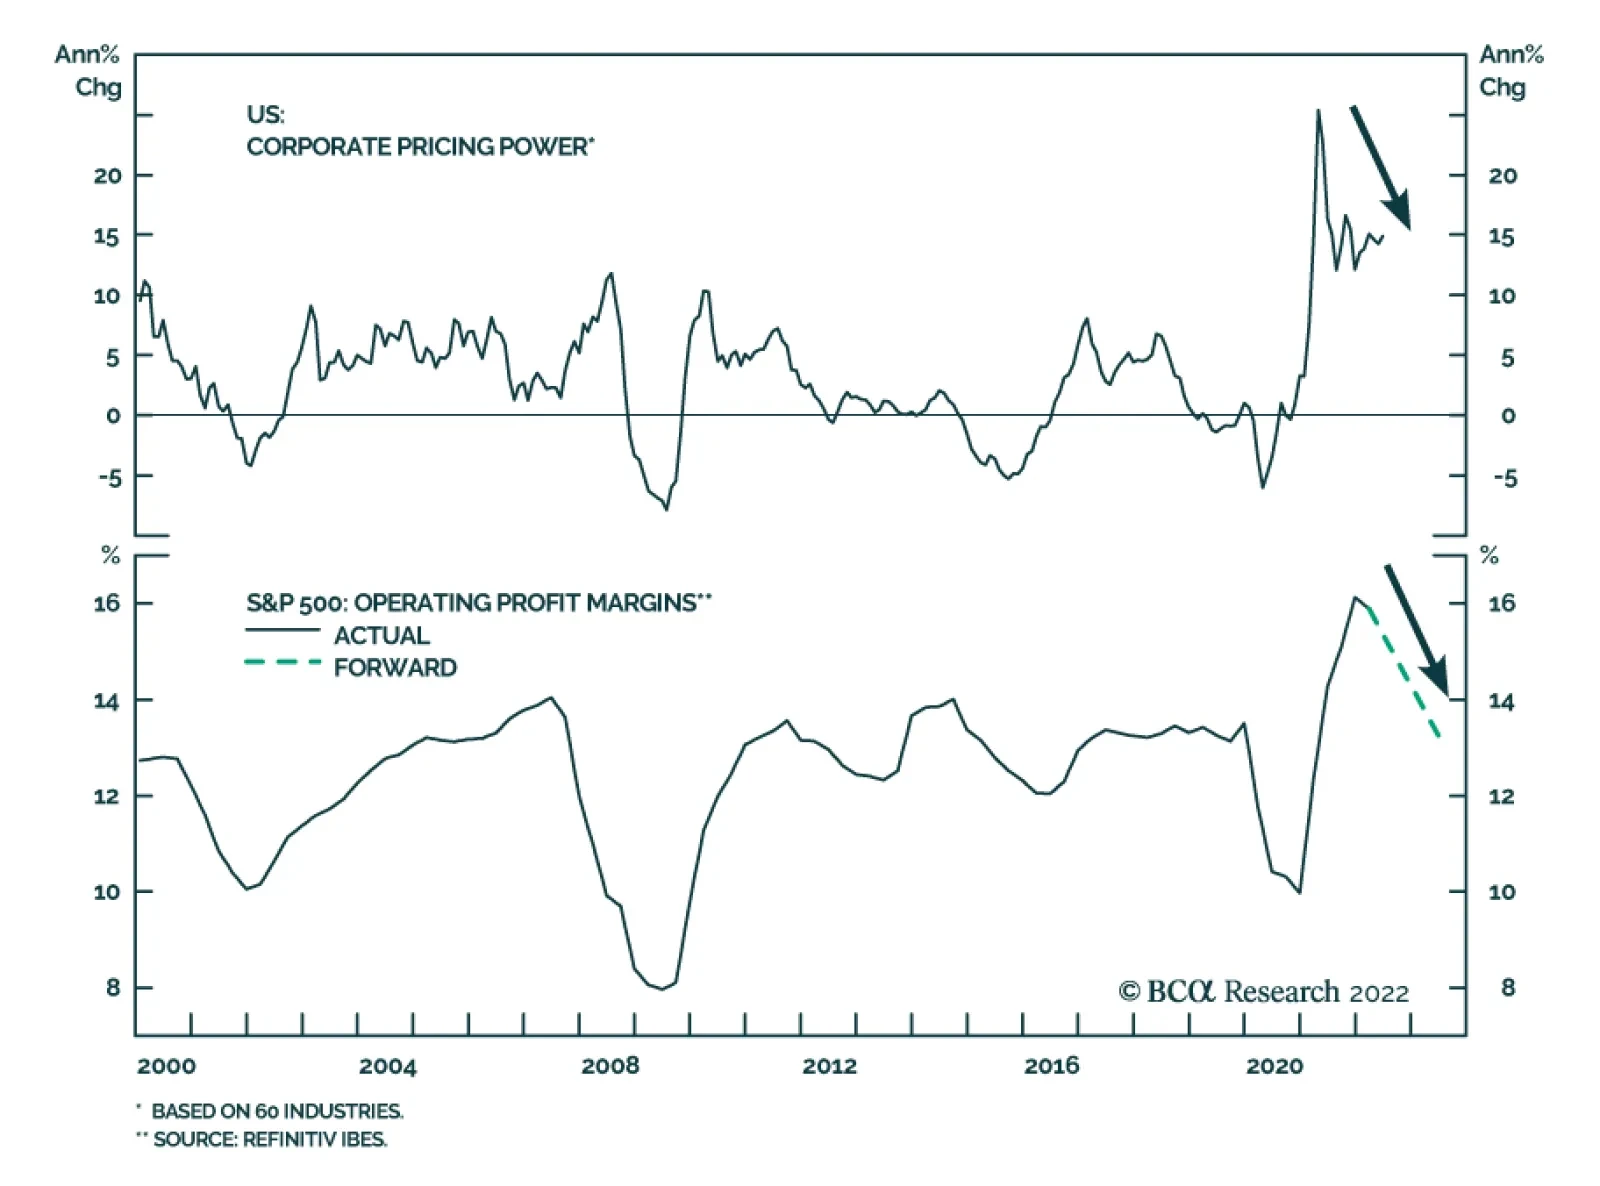
Earnings Outlook What are your takeaways from the earnings seasons so far? In the Daily Insight, which we published on July 21, we offer our initial reaction to the results. In short, so far earnings have been good, but margins are under pressure (Chart 4) from rising wages and fading pricing power (Chart 5). We have also heard quite a few negative comments from companies concerning the effects of inflation and rising costs, a strong dollar, and withdrawal from Russia. Some of the largest Technology companies announced slowdowns in hiring as they anticipate falls in demand. Forward guidance has also been concerning. Most companies talk about deteriorating economic conditions. Chart 4Margins Are Expected To Contract
Margins Are Expected To Contract
Margins Are Expected To Contract
Chart 5Pricing Power Turning
Pricing Power Turning
Pricing Power Turning
We are still convinced that street forecasts of earnings growing at about a 10% rate over the next 12 months and 11% into year-end (Table 1), despite ubiquitous negative corporate guidance, are unrealistically high. Even in this reporting season for Q2-22, earnings growth is -3%, excluding Energy. Table 1S&P 500 EPS: Actual And Expected
What Our Clients Are Asking: The Bear Market 2.0 Webcast Follow Up
What Our Clients Are Asking: The Bear Market 2.0 Webcast Follow Up
It is unlikely that, over the next several months, macro headwinds, such as slowing growth, the hawkish Fed, stubborn inflation, and rising wages will dissipate. There is little consensus among analysts on forecasts (Chart 6) and downgrades are likely. We take it a step further, and call an earnings recession in three to six months. Chart 6Analysts Have Little Confidence In Their Forecasts
Analysts Have Little Confidence In Their Forecasts
Analysts Have Little Confidence In Their Forecasts
Bottom Line: Q2-2022 results show that an earnings slowdown has most likely already commenced and is bound to get worse over the next couple of quarters. However, earnings forecasts are still too optimistic and a slowdown in earnings growth is not yet priced in. Do you think that the slowdown in earnings might trigger multiple expansion? Earnings contraction, everything else equal, translates into multiple expansion, as the denominator of the fraction gets smaller. For example, according to our back-of-the-envelope estimates, earnings contracting by 10% will increase the forward multiple from the current 16x to 19x. Therefore, the key question here is how likely is it that everything else will indeed stay equal, as opposed to the market selling off in line with earnings? Multiples will expand if the market is able to see past negative earnings growth, identifying a catalyst for an imminent rebound. That was the case in 2020 as investors anticipated earnings bouncing back helped by easy monetary and fiscal policy, and COVID receding. What will be a catalyst for earnings rebound in, say, 2023? We can only speculate but one of the potential reasons for faster earnings growth is perhaps normalization of growth outside of the US: A weaker dollar, peace in Ukraine, resolution of the energy crisis, or ultra-loose monetary and fiscal policy in China. At home, the anticipation of a soft landing and a more dovish monetary policy coupled with a positive real wage growth boosting consumers’ spending power may be sufficient to reassure investors that earnings growth turning positive is imminent. However, all of these developments are probably months away. And we expect the market to sell off if earnings growth disappoints. Where do you see the S&P 500 by the end of the year? Broadly speaking, BCA Research does not provide targets but rather aims to offer insights into market trends. However, in the “Is Earnings Recession In The Cards?” report, we presented a matrix outlining different scenarios of earnings growth vs. forward multiples to arrive at a potential range of the outcomes for the index. We assume that the forward multiple stays at 16x, as the multiple contraction stage of the bear market is likely completed, but there is still no clear catalyst for earnings rebound. We will approximate CY 2022 results using the Next Twelve Months Matrix (Table 2). Table 2The S&P 500 Price Target Scenarios
What Our Clients Are Asking: The Bear Market 2.0 Webcast Follow Up
What Our Clients Are Asking: The Bear Market 2.0 Webcast Follow Up
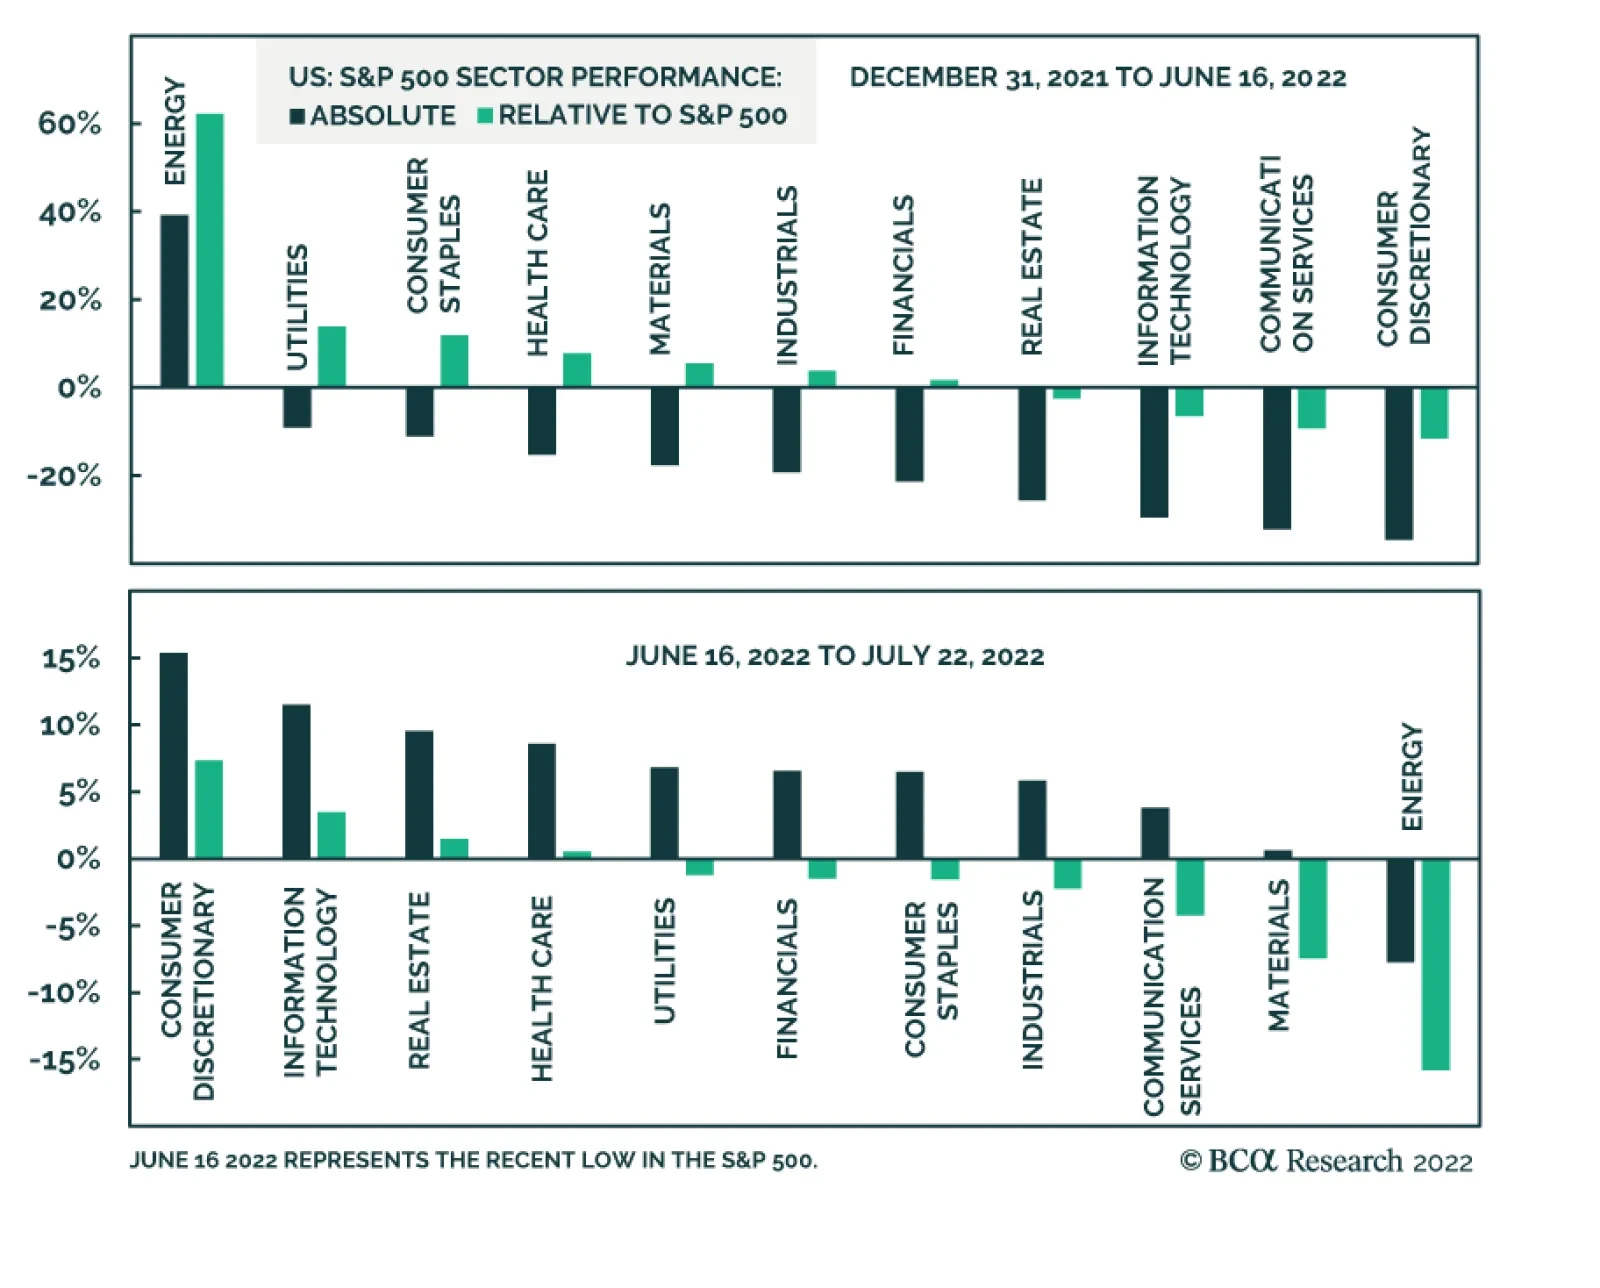
We can distill the matrix into three likely scenarios: Earnings growth delivered by companies in line with analyst expectations of 11% over the six months; flat earnings (0% growth) broadly in line with the forecast based on our earnings model; and the worst-case scenario of a severe earnings contraction of -10% into year-end. We assign 25% to both extreme cases and about 50% to earnings staying flat for the next six months (earnings recession commencing in 2023). Best-case scenario: Earnings grow into year-end by 11%, and by 9.7% over the next 12 months. In that case, the S&P 500 will end the year at 3,837 or 3% off the current level. This is what is being priced in. Most likely scenario: Earnings growth trends to zero by the end of the year with the S&P 500 hitting 3500 or downshifting roughly 10% from here. Worst-case scenario: Earnings contract by 10%, and with the multiple staying at 16x, the S&P 500 price target will be 3287 or about 17% lower than today. With “E” falling so much, perhaps the multiple expands to 17x, in which case the market will fall “only” 11% from here. Bottom Line: We expect flagging earnings to cause another leg of the bear market, which is likely to be 5-10% into year-end, and perhaps another 5-10% in 2023. Equity Market Outlook And Key Investment Themes Are investors capitulating? Are we near or even past the bottom? The decline in oil and food prices and the easing of supply-side bottlenecks have alleviated market worries about US inflation. This, coupled with oversold risk assets, and apparent extreme pessimism in investor sentiment, has resulted in the S&P 500 rebounding 8% from its June lows. Sectors that have sold off the most over the past six months have bounced back the hardest (Chart 7). Naturally, the question that is top of mind for investors is whether this rebound is sustainable. Should they add beaten-down cyclicals to their portfolios to partake in the rally? Of course, no one can predict what Mr. Market will do with 100% certainty but here are some thoughts: Chart 7Sector Performance Overview
What Our Clients Are Asking: The Bear Market 2.0 Webcast Follow Up
What Our Clients Are Asking: The Bear Market 2.0 Webcast Follow Up
Positives Many risk assets are severely oversold, and for long-term investors, an entry point is attractive valuation-wise. So far, many investors find earnings season results somewhat encouraging: Netflix soared on what its CEO Hawkins called “less bad results.” Multiples have contracted and priced in most of the primary effects of high inflation and rising rates. Negatives The Fed is determined to extinguish inflation, and this hiking cycle may end up much longer and steeper than the market is pricing in. We do not anticipate monetary easing in the first half of 2023. Financial markets are currently underrating the risk of a seriously hawkish Fed. Economic growth is slowing, and consensus forecasts of earnings growth are still overly optimistic. Earnings contraction over the next several quarters is likely but is certainly not priced in, and disappointment may rock markets. The catalyst for this summer’s rebound is two-fold: The market is celebrating the end of inflation worries and is rebounding from severely oversold conditions. Black swan “generators” such as China and Russia, may have more surprises in stock (Table 3). We continue to stick to “fat and down” expectations for the equities outlined in the “Adaptive Expectations” report and anticipate a range-bound market where relief rallies are alternated with pullbacks, mostly triggered by growth disappointments and realizations that the Fed has dug in its heels and is unlikely to let up anytime soon. The “down” leg will ensue if earnings contract. Yet we recommend investors take a granular approach to industry selection and start tilting portfolios away from assets that benefit from rising inflation, such as Energy and Materials, towards the “growthy” assets that benefit from rate stabilization and falling growth. We picked up on the turning point and upgraded Growth to overweight in early July, funding it from Value. Table 3Scorecard
What Our Clients Are Asking: The Bear Market 2.0 Webcast Follow Up
What Our Clients Are Asking: The Bear Market 2.0 Webcast Follow Up
Bottom Line: We consider the recent rebound in US equities a bear market rally, and don’t believe that it is sustainable. The Fed and the stock market are on a collision course – easier financial conditions will make the Fed even more aggressive. Is it time to buy Tech? As we have highlighted in the “Are We There Yet?!” report back in January, Tech’s worst performance is two to three months prior to the first rate hike, and the rebound is two to three months after the beginning of the monetary cycle. The slump and a recent rally are perfectly in line with history (Chart 8). Rates have stabilized and “growthy” Tech has pounced (Chart 9). Another issue that was holding the sector back earlier in the year was a slowdown in demand for Tech investment (Chart 10). Recently, business demand for Tech has picked up. However, US consumer spending on Tech is falling, as demand for consumer goods, pulled forward by the pandemic, is fading (Chart 11). Therefore, we need to be judicious in our selection of technology stocks. Chart 8Tech Performance During A Hiking Cycle
What Our Clients Are Asking: The Bear Market 2.0 Webcast Follow Up
What Our Clients Are Asking: The Bear Market 2.0 Webcast Follow Up
Chart 9Technology Rebounded On The Back Of Yields Peaking
Technology Rebounded On The Back Of Yields Peaking
Technology Rebounded On The Back Of Yields Peaking
Chart 10Corporate Demand For Tech Has Picked Up…
Corporate Demand For Tech Has Picked Up…
Corporate Demand For Tech Has Picked Up…
We reiterate our overweight in Software and Services, which is least exposed to consumer demand. Our thesis is that this industry group represents “defensive growth” thanks to the key trends of digitization of the US economy and migration to cloud. Spending on digitization and the cloud are pervasive across non-tech companies and capture a large swath of corporate America by both size and industry. Also, software and services companies tend to have stable earnings growth throughout the cycle, as software improves productivity and cuts costs (Chart 12). Chart 11...But Consumer Spending Slowed
...But Consumer Spending Slowed
...But Consumer Spending Slowed
Chart 12Software Is Defensive Growth
Software Is Defensive Growth
Software Is Defensive Growth
We are underweight more cyclical Hardware and Equipment, and Semiconductors industry groups as they are more exposed to the slowing economy and the flagging demand for hardware and chips. We will take a close look at the Semiconductor Industry Group in the near future. Bottom Line: We recommend topping up allocation to tech as it benefits from rate stabilization. However, be judicious in your choices, staying away from the more cyclical areas, such as Hardware and Equipment, and Semiconductors. We are overweight Software and Services, which is dominated by profitable and stable growth companies. Irene Tunkel Chief Strategist, US Equity Strategy irene.tunkel@bcaresearch.com Recommended Allocation Recommended Allocation: Addendum
What Our Clients Are Asking: The Bear Market 2.0 Webcast Follow Up
What Our Clients Are Asking: The Bear Market 2.0 Webcast Follow Up
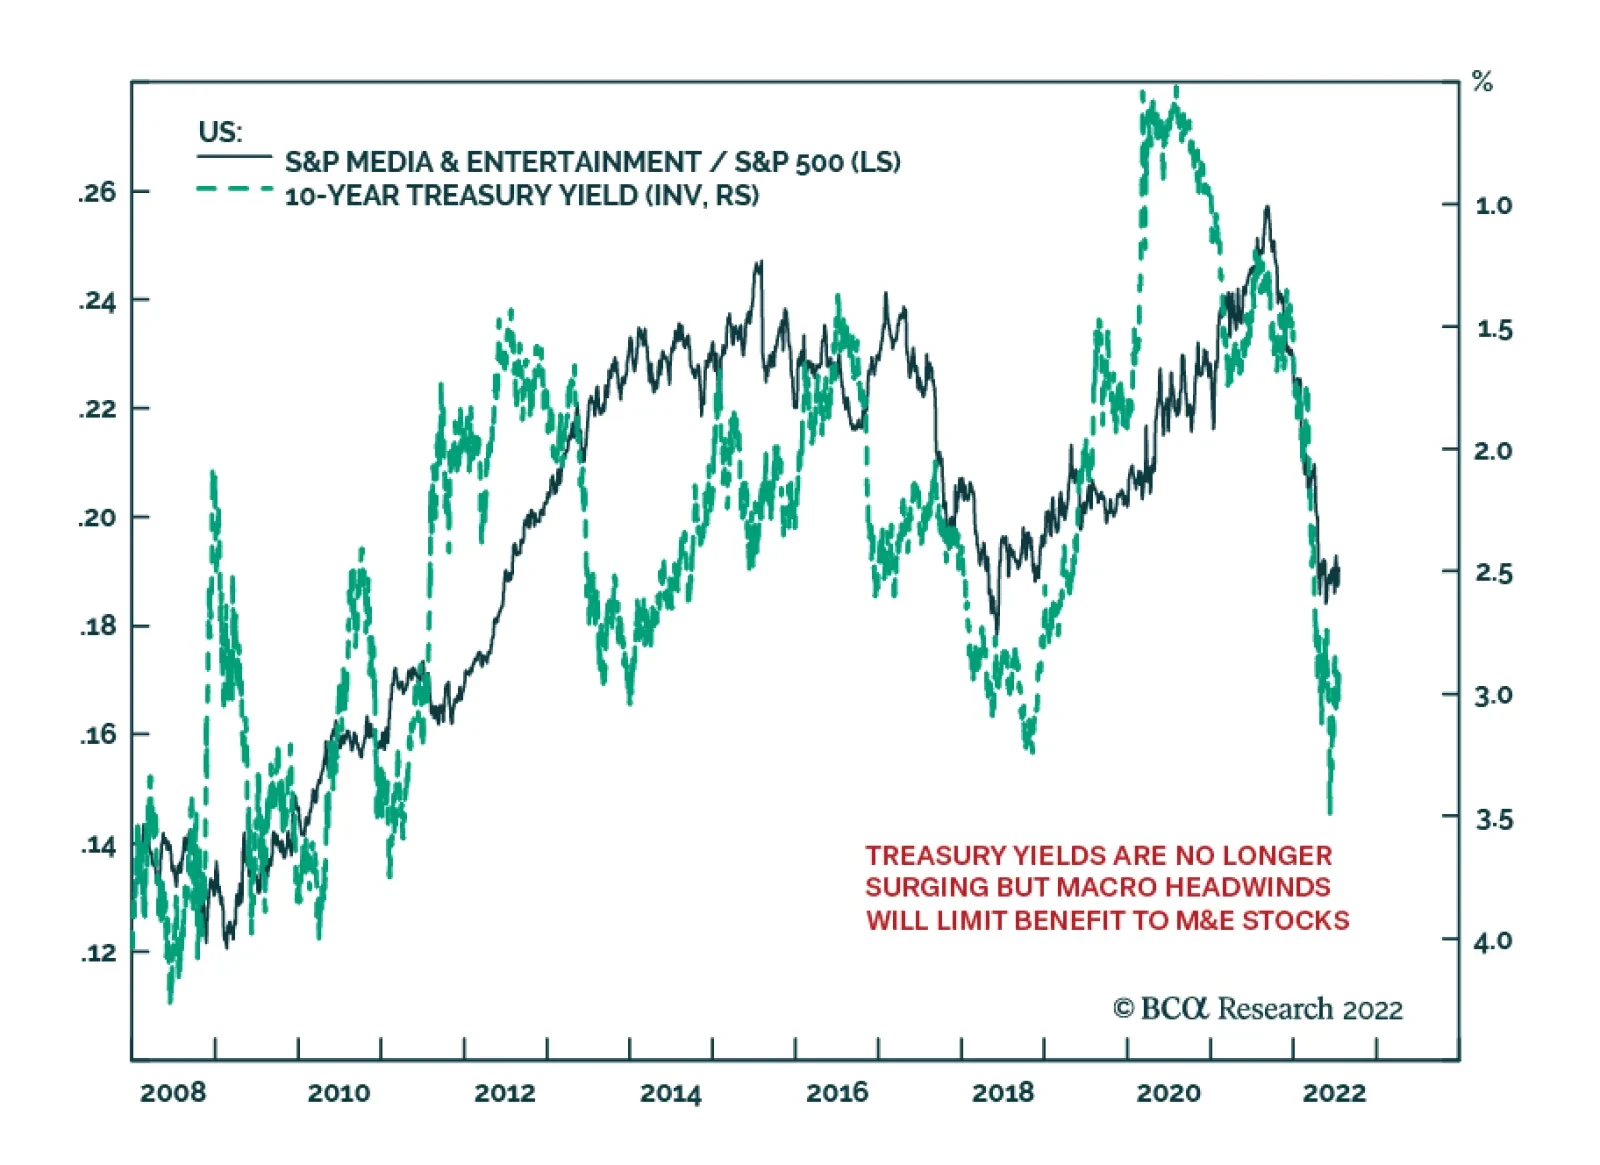
Snap, Twitter Results Warn Of Headwinds To Other M&E Stocks
…
Listen to a short summary of this report. Executive Summary The odds of a recession in the US are lower than widely perceived. The probability of a recession is higher in Europe, although this week’s partial resumption of gas flows through the Nord Stream 1 pipeline, along with increased use of coal-fired power plants, should soften the blow. Chinese growth should rebound in the second half of the year. However, the specter of future lockdowns, the shift in global spending away from manufactured goods towards services, and the weakening property sector will continue to weigh on activity. With the Twentieth Party Congress slated for later this year, it is increasingly likely that the authorities will open up a firehose of stimulus. Fading recession risks will buoy stocks in the near term. However, a brighter economic outlook also means that the Fed, and several other central banks, may see little need to cut policy rates in 2023, as the markets are currently discounting. The end result is that government bond yields will rise from current levels, implying that stock valuations will not return to last year’s levels even if a recession is averted. After Rapidly Raising Rates, Markets Expect Some DM Central Banks To Start Easing Next Year
The Downside Of A Soft Landing
The Downside Of A Soft Landing
Bottom Line: We recommend a modest overweight on global equities for now but would turn neutral if the S&P 500 were to rise above 4,050. Dear Client, I am delighted to announce that Ritika Mankar, CFA, has joined the Global Investment Strategy team. Ritika will be writing occasional special reports on a variety of topical issues. Next week, she will make the case that the US economy’s ability to spawn mega-sized companies may become increasingly compromised over the next decade. Best regards, Peter Berezin, Chief Global Strategist The Case for a Soft Landing in the US Chart 1Cyclicals Underperformed Defensives As Recession Risks Intensified
Cyclicals Underperformed Defensives As Recession Risks Intensified
Cyclicals Underperformed Defensives As Recession Risks Intensified
Over the last few months, investors have become concerned that the Fed and many other central banks will need to engineer a recession in order to bring inflation down to more comfortable levels. While these fears have abated over the past trading week, they still continue to dominate market action (Chart 1). We place the odds of a US recession at about 40%. This is arguably more optimistic than the consensus view. According to Bank of America, the majority of fund managers saw recession as likely in this month’s survey. Not surprisingly, investors consider recession to be a major risk for equities over the next 12 months (Chart 2). Chart 2Many Investors Now See Recession As Baked In The Cake
The Downside Of A Soft Landing
The Downside Of A Soft Landing
Even if a recession does occur, we have contended that it will likely be a mild one, perhaps so mild that it will be difficult to distinguish it from a soft landing. A number of things make a soft landing in the US more probable than in the past: Labor supply has scope to increase. The labor participation rate is still 1.2 percentage points below its pre-pandemic level, two-thirds of which is due to decreased participation among workers under the age of 55 (Chart 3). The share of workers holding multiple jobs is also below its pre-pandemic level (Chart 4). The number of multiple job holders has been rising briskly lately. That is one reason why job growth in the payroll survey – which double counts workers if they hold more than one job – has been stronger than job growth in the household survey. Increased labor supply would obviate the need for the Fed to take drastic actions to curtail labor demand in its effort to restore balance to the labor market. Chart 3Labor Supply Has Scope To Rise
Labor Supply Has Scope To Rise
Labor Supply Has Scope To Rise
Chart 4The Number Of Multiple Job Holders Is Still Below Pre-Pandemic Levels
The Number Of Multiple Job Holders Is Still Below Pre-Pandemic Levels
The Number Of Multiple Job Holders Is Still Below Pre-Pandemic Levels
A high level of job openings creates a moat around the labor market. There are almost two times as many job openings as there are unemployed workers in the US (Chart 5). Many firms are likely to pull job openings before they cut jobs in response to a slowing economy. A high level of job openings will also allow workers who lose their jobs to find employment more quickly than usual, thus limiting the rise in so-called frictional unemployment. It is worth noting that the job openings rate has declined from a record 7.3% in March to a still-high 6.9% in May, with no change in the unemployment rate over this period. Chart 5A High Level Of Job Openings Creates A Moat Around The Labor Market
A High Level Of Job Openings Creates A Moat Around The Labor Market
A High Level Of Job Openings Creates A Moat Around The Labor Market
A steep Phillips curve implies that only a modest increase in unemployment may be necessary to knock down inflation towards the Fed’s target. Just as was the case in the 1960s, the Phillips curve has proven to be kinked near full employment (Chart 6). Unlike in the late 1960s, however, when rising realized inflation caused long-term inflation expectations to reset higher, expectations have remained well anchored this time around (Chart 7). Chart 6The Phillips Curve Is Kinked At Very Low Levels Of Unemployment
The Downside Of A Soft Landing
The Downside Of A Soft Landing
Chart 7Long-Term Inflation Expectations Are Well Anchored
Long-Term Inflation Expectations Are Well Anchored
Long-Term Inflation Expectations Are Well Anchored
The unwinding of pandemic and war-related dislocations should push down inflation. A recent study by the San Francisco Fed estimates that about half of May’s PCE inflation print was the result of supply-side disturbances (Chart 8). While the ongoing war in Ukraine and the threat of another Covid wave in China will continue to unsettle global supply chains, these problems should fade over time. Falling inflation would allow real wages to start rising again. This would bolster confidence, making a soft landing more likely (Chart 9). Chart 8Supply Factors Explain Half Of The Increase In Prices Over The Past Year
The Downside Of A Soft Landing
The Downside Of A Soft Landing
Chart 9Positive Real Wage Growth Will Bolster Consumer Confidence
Positive Real Wage Growth Will Bolster Consumer Confidence
Positive Real Wage Growth Will Bolster Consumer Confidence
A lack of major financial imbalances makes the US economy more resilient to economic shocks. As a share of disposable income, US household debt is 34 percentage points below its 2008 peak (Chart 10). Relative to net worth, household debt is at multi-decade lows. About two-thirds of mortgages carry a FICO score above 760 compared to only one-third during the housing bubble (Chart 11). Non-mortgage consumer credit also remains in good shape, as my colleague Doug Peta elaborated in this week’s US Investment Strategy report. While corporate debt has risen over the past decade, the ratio of corporate debt-to-assets today is still below where it was during the 1990s. Moreover, thanks to stronger corporate profitability, the interest coverage ratio is near an all-time high (Chart 12). Chart 10AUS Household Debt Is Not Especially High Anymore (I)
US Household Debt Is Not Especially High Anymore (I)
US Household Debt Is Not Especially High Anymore (I)
Chart 10BUS Household Debt Is Not Especially High Anymore (II)
US Household Debt Is Not Especially High Anymore (II)
US Household Debt Is Not Especially High Anymore (II)
Chart 11FICO Scores For Residential Mortgages Have Improved Considerably Since The Pre-GFC Housing Bubble
The Downside Of A Soft Landing
The Downside Of A Soft Landing
Chart 12Corporate Balance Sheets Are In Decent Shape
Corporate Balance Sheets Are In Decent Shape
Corporate Balance Sheets Are In Decent Shape
Chart 13Tight Supply Limits The Downside Risks To Housing
Tight Supply Limits The Downside Risks To Housing
Tight Supply Limits The Downside Risks To Housing
Just like the US does not suffer from major financial imbalances, it does not suffer from any major economic imbalances either. The homeowner vacancy rate is near a record low, which should put a floor under residential investment (Chart 13). Outside of investment in intellectual property, which is not especially sensitive to the business cycle, nonresidential investment is still below pre-pandemic levels and not much above where it was as a share of GDP during the Great Recession (Chart 14). Spending on consumer durable goods has retraced four-fifths of its pandemic surge, with little ill-effect on aggregate employment (Chart 15). Chart 14Outside Of IP, Nonresidential Investment Is Still Low
Outside Of IP, Nonresidential Investment Is Still Low
Outside Of IP, Nonresidential Investment Is Still Low
Chart 15Spending On Durable Goods Has Been Normalizing Without Derailing The Economy
Spending On Durable Goods Has Been Normalizing Without Derailing The Economy
Spending On Durable Goods Has Been Normalizing Without Derailing The Economy
Europe: A Deep Freeze Will Likely Be Avoided Chart 16Russia Can Potentially Cause Significant Economic Damage In The EU If It Closes The Taps
The Downside Of A Soft Landing
The Downside Of A Soft Landing
The macroeconomic picture is less benign outside the US. Four years ago, German diplomats laughed off warnings that their country had become dangerously dependent on Russian energy. They are not laughing anymore. German industry, just like industry across much of Europe, is facing a major energy crunch. The IMF estimates that output losses associated with a full Russian gas shutoff over the next 12 months could amount to as much as 2.7% of GDP in the EU (Chart 16). In Central and Eastern Europe, output could shrink by 6%. Among the major economies, Germany and Italy are the most at risk. Fortunately, Europe is finally stepping up to the challenge. The highly ambitious REPowerEU plan seeks to displace two-thirds of Russian gas by the end of 2022. The plan does not include any additional energy that could be generated by increased usage of coal-fired power plants, a strategy that the European political establishment (including the German Green Party!) has only recently begun to champion. It is possible that EU leaders felt the need to generate a crisis mentality to justify the decision to burn more coal. Dire warnings about how Europe is prepared to ration gas also send a message to Russia that the EU is ready to suffer in order to thwart Putin’s despotic regime. Whether Europe actually follows through is a different story. It is worth noting that the Nord Stream 1 pipeline resumed operations this week after Germany received, over Ukrainian objections, a repaired turbine from Canada. The resumption of partial flows through the pipeline, along with increased fiscal support for households and firms, reduces the risks of a “deep freeze” recession in Europe. The unveiling of the ECB’s new Transmission Protection Instrument (TPI) this week should also help anchor sovereign credit spreads across the euro area. While the exact conditions under which the TPI will be engaged have yet to be fleshed out, we expect the terms to be fairly liberal, reflecting not only the lessons learned from last decade’s euro debt crisis, but also to serve as a powerful bulwark against Putin’s efforts to destabilize the EU economy. China: Government’s Growth Target Looks Increasingly Unrealistic Stronger growth in China would help European exporters (Chart 17). Chinese real GDP grew by just 0.4% in the second quarter from a year earlier as the economy was battered by Covid lockdowns. Activity should pick up in the second half of the year, but at this point, the government’s 5.5% growth target looks completely unachievable. The specter of future lockdowns, the shift in global spending away from manufactured goods towards services, and the weakening Chinese property sector are all weighing on the economy (Chart 18). Chart 17European Exporters Would Welcome A Stronger Chinese Economy
European Exporters Would Welcome A Stronger Chinese Economy
European Exporters Would Welcome A Stronger Chinese Economy
The authorities will likely seek to stimulate the economy by allowing local governments to bring forward $220 billion in bond issuance that had been originally slated for 2023. The problem is that land sales – the main source of local government revenue – have collapsed. Worried about the ability of local governments to service their obligations, both retail investors and banks have shied away from buying local government debt. Chart 18A Slowing Property Market And Covid Lockdowns Have Been Weighing On The Chinese Economy
A Slowing Property Market And Covid Lockdowns Have Been Weighing On The Chinese Economy
A Slowing Property Market And Covid Lockdowns Have Been Weighing On The Chinese Economy
Meanwhile, the inability of property developers to secure adequate financing to complete construction projects has left a growing number of home buyers in the lurch. In most cases, these properties were purchased off-the-plan. Understandably, home buyers have balked at the prospect of having to make mortgage payments on properties that they do not possess. With the Twentieth Party Congress slated for later this year, it is increasingly likely that the authorities will open up a firehose of stimulus, including increased assistance for property developers and banks, as well as income-support measures for households. While such measures will not address China’s myriad structural problems, they will help keep the economy afloat. Equity Valuations in a Soft-Landing Scenario A few weeks ago, the consensus view was that stocks would tumble in the second half of the year as the global economy fell into recession but would then rally in 2023 as central banks began lowering rates. We argued the opposite, namely that stocks would likely rebound in the second half of the year as the economy outperformed expectations but would then face renewed pressure in 2023 as it became clear that the Fed and several other central banks had no reason to cut rates (Chart 19). Chart 19After Rapidly Raising Rates, Markets Expect Some DM Central Banks To Start Easing Next Year
The Downside Of A Soft Landing
The Downside Of A Soft Landing
Chart 20Real Rates Have Jumped This Year
Real Rates Have Jumped This Year
Real Rates Have Jumped This Year
In a baseline scenario where a recession is averted, we argued that the S&P 500 could rise to 4,500 (60% odds). In contrast, we noted that the S&P 500 could fall to 3,500 in a mild recession scenario (30% odds) and to 2,900 in a deep recession scenario (10% odds). It is worth stressing that even at 4,500, the S&P 500 would still be 11% lower in real terms than it was on January 4th. At the stock market’s peak in January, the 10-year TIPS yield stood at -0.91%, while the 30-year TIPS yield stood at -0.27%. Today, they stand at 0.58% and 0.93%, respectively (Chart 20). If real rates do not return to their prior lows, it is unlikely that equity valuations will return to their prior highs. This limits the upside for stocks, even in a soft-landing scenario. The sharp rally in stocks over the past week has priced out some of this recession risk, moving equity valuations closer towards what we regard as fair value. As we noted last week, we will turn neutral on equities if the S&P 500 were to rise above 4,050. As we go to press, we are only 1.3% from that level. Peter Berezin Chief Global Strategist peterb@bcaresearch.com Follow me on LinkedIn & Twitter Global Investment Strategy View Matrix
The Downside Of A Soft Landing
The Downside Of A Soft Landing
Special Trade Recommendations Current MacroQuant Model Scores
The Downside Of A Soft Landing
The Downside Of A Soft Landing
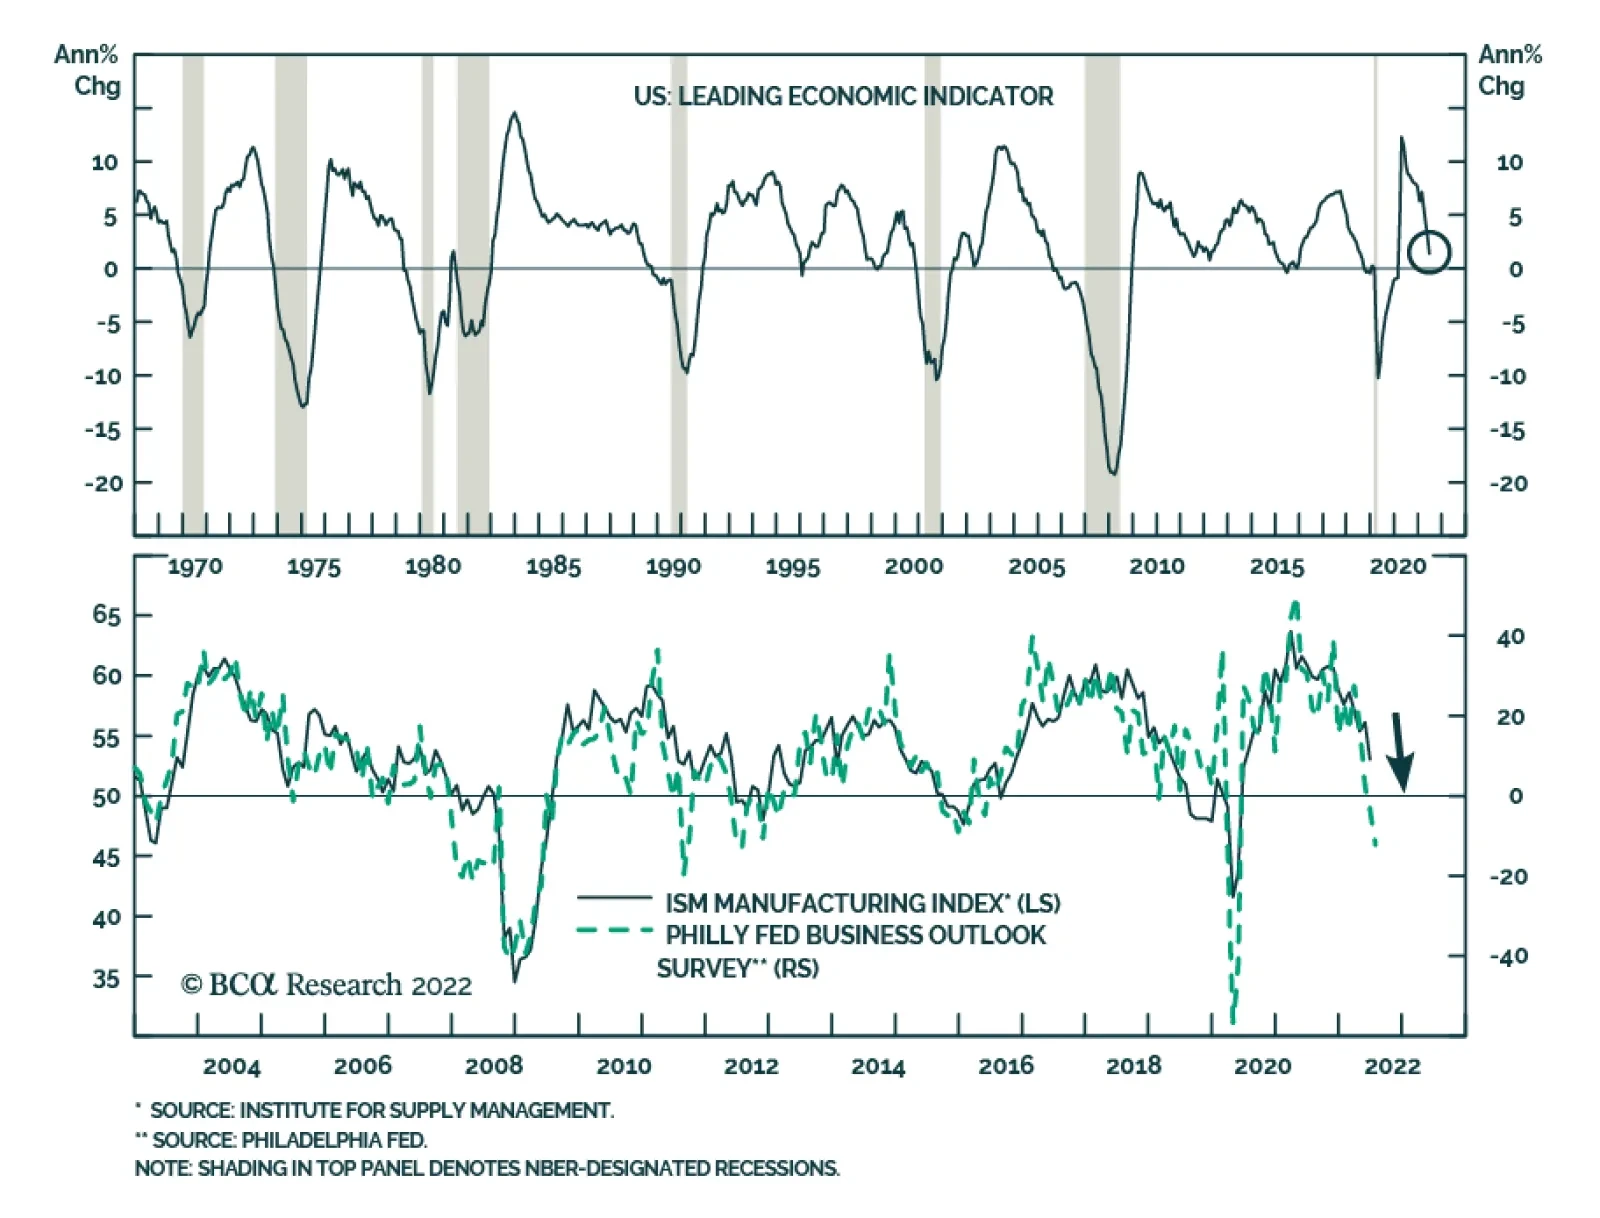
The Conference Board US Leading Economic Index (LEI) deteriorated further in June, contracting by a larger-than-expected 0.8% following a 0.4% decline in May. Consumer sentiment, labor market conditions, stock prices and manufacturing new orders were the main…
Executive Summary Investors Should Mind Surging US Wages
Investors Should Mind Surging US Wages
Investors Should Mind Surging US Wages
Despite Western sanctions on Russia, the country’s oil exports have not collapsed. According to the International Energy Agency’s (IEA) estimates, Russia’s shipments of crude and oil products have declined by only 5% since January. The combination of relatively stable supply and downshifting global oil demand constitutes a bearish cocktail for oil prices. Odds are that oil prices will decline further and recouple with industrial and precious metal prices. Labor costs are more important than oil prices for the US core inflation outlook and, hence, for Fed policy. In the US, surging wages and easing financial conditions would make the Fed even more committed to tightening monetary policy substantially. The Fed and the stock market remain on a collision course. EM/China exports will contract, and their domestic demand will also struggle. Bottom Line: As the US dollar continues to overshoot, EM stocks will underperform DM equities, and EM credit markets will underperform US credit markets on a quality-adjusted basis. An underweight position in EM in global equity and credit portfolios is warranted. Feature The decline in oil and food prices and the easing of supply-side bottlenecks have alleviated market worries about US inflation. As a result, the S&P500 has rebounded, despite the grim inflation report last week. BCA’s Emerging Markets Strategy team expects oil and industrial metal prices to drop further. Does this mean that the worst of both US inflation and the Fed’s tightening is behind us and that it is time to buy risk assets? Not really. In this report, we discuss (1) why oil prices will drop further, (2) why the worst of US monetary tightening is not over, and (3) why emerging markets are not out of the woods. In fact, EM asset prices have so far failed to advance, despite the rebound in the S&P500. This is true for EM stocks, currencies, EM credit spreads, and domestic bonds (Charts 1 and 2). Overall, our macro themes of Fed tightening amid slowing global growth, the US dollar overshooting, and China’s disappointing recovery remain intact. These factors still warrant a defensive investment strategy, despite a possible near-term rebound in the S&P 500. EMs will lag and underperform in this rebound. Chart 1No Rebound In EM Stocks And Currencies…
No Rebound In EM Stocks And Currencies...
No Rebound In EM Stocks And Currencies...
Chart 2…Nor In EM Credit Space And Local Bonds
...Nor In EM Credit Space And Local Bonds
...Nor In EM Credit Space And Local Bonds
Oil Prices Will Drop But… Chart 3Russian Oil Export Volumes Have Dropped Only By 5% Since January
Russian Oil Export Volumes Have Dropped Only By 5% Since January
Russian Oil Export Volumes Have Dropped Only By 5% Since January
Odds are that crude prices have peaked and face material downside: Despite the sanctions and logistical challenges that Western governments have enforced on Russia, the country’s oil exports have not collapsed. According to the International Energy Agency’s (IEA) estimates, Russia’s shipments of crude and oil products have declined by only 5% since January (Chart 3). Even though Saudi Arabia appears to be committed to its production management policy, it cannot completely ignore US demands to raise its oil output. Odds are that Saudi Arabia and the United Arab Emirates will boost their oil output in the coming months. Chart 4US And Chinese Oil Consumption Is Weak
US And Chinese Oil Consumption Is Weak
US And Chinese Oil Consumption Is Weak
In the meantime, global oil demand is shrinking, in part due to high prices. US consumption of gasoline and other motor fuel has marginally contracted (Chart 4, top panel). In China, rolling lockdowns and weak income growth will continue to suppress the nation’s crude oil imports, which have already been depressed over the past 12 months (Chart 4, bottom panel). In the rest of EM (excluding China), high oil prices in their local currency terms are leading to demand destruction. Chart 5 illustrates that oil and food prices in local currency terms are still very elevated for EM. When various commodity prices – ranging from industrial and precious metals, to soft commodities, and oil – all drop simultaneously and precipitously, it suggests that supply is not what is dominating the price action (Chart 6). Their supply is idiosyncratic, so the concurrent fall in their prices cannot be explained by their production. Chart 5Oil And Food Prices In EM Currencies
Oil And Food Prices In EM Currencies
Oil And Food Prices In EM Currencies
Chart 6The Simultaneous Drop In Various Commodity Prices Cannot Be Explained By Supply
The Simultaneous Drop In Various Commodity Prices Cannot Be Explained By Supply
The Simultaneous Drop In Various Commodity Prices Cannot Be Explained By Supply
Our interpretation for the synchronized decline in various commodity prices is as follows: the sanctions imposed on Russia initially led buyers to increase their precautionary and speculative purchases of various commodities, which was a tailwind for prices. However, these precautionary and speculative purchases have since been halted or reversed, causing commodity prices to plunge. From the perspective of business and financial cycles, oil prices are a lagging variable. Their turning points often occur after the peaks or bottoms in global cyclical stock prices (Chart 7). Chart 7Oil Prices Often Lag Global Cyclical Stocks
Oil Prices Often Lag Global Cyclical Stocks
Oil Prices Often Lag Global Cyclical Stocks
In contrast with the downbeat investor sentiment on risk assets, investor sentiment on oil prices remains very elevated (Chart 8). In terms of market technicals, the outlook for oil prices and energy stocks is troublesome. Crude prices have lately formed a double top (see Chart 6 above). From a long-term perspective, oil prices and global energy share prices in SDR1 terms might have formed a triple top (Chart 9). Chances are that the recent top in crude prices and energy stocks is a major one and a protracted selloff is in the cards. Chart 8Investors Are Still Bullish On Oil
Investors Are Still Bullish On Oil
Investors Are Still Bullish On Oil
Chart 9A Triple Top In Oil Prices And Global Energy Stocks
A Triple Top In Oil Prices And Global Energy Stocks
A Triple Top In Oil Prices And Global Energy Stocks
Bottom Line: Fears that sanctions on Russia would considerably reduce global oil supply have not yet materialized. Meanwhile, global oil demand is downshifting in response to both high fuel prices and weakening global growth. In addition, the US is leveraging its geopolitical power to push Gulf countries to boost oil production. These forces all constitute a bearish cocktail for oil prices. That said, a flare-up in geopolitical tensions in the Middle East around Iran is a potential risk to our view on oil, as it would push crude prices up again. …Surging Wages Will Keep US Core Inflation Elevated Chart 10Investors Should Mind Surging US Wages
Investors Should Mind Surging US Wages
Investors Should Mind Surging US Wages
A drop in oil prices has brought some relief to US financial markets as US inflation expectations have dropped materially. Yet, we do not think the drop in oil or food prices – and hence in US headline inflation – will lead to a less hawkish stance from the Fed. The basis for this belief is that US inflationary pressures are genuine and have been broadening. In fact, as we have argued since late last year, the US has entered a wage-price spiral. Recent wage data from the Atlanta Fed validates this thesis – US wage growth has surged to around 7% (Chart 10). To be technically correct, unit labor costs, not wages, are key to inflation dynamics (Chart 11). Unit labor cost = (wage per hour) / (productivity). Productivity is output per hour. Chart 11Unit Labor Costs, Not Oil, Drive US Core Inflation
Unit Labor Costs, Not Oil, Drive US Core Inflation
Unit Labor Costs, Not Oil, Drive US Core Inflation
Given that labor, not oil, is the largest cost component of US businesses, unit labor costs swell and profit margins shrink when salaries rise faster than productivity. CEOs and business owners always do their best to protect their profit margins. Thus, accelerating unit labor costs will lead them to raise their selling prices. A wage-price spiral will be unleashed if consumers accept these higher prices and go on to demand even higher wages. Chart 12US Core Inflation Is Broadening And Is Well Above The Fed's Target
US Core Inflation Is Broadening And Is Well Above The Fed's Target
US Core Inflation Is Broadening And Is Well Above The Fed's Target
This is why wage costs, and more specifically unit labor costs, are the most important variable to monitor for the inflation outlook. If consumers facing high energy and food prices are able to successfully negotiate greater wage gains that surpass their productivity growth, then inflation will become more broad-based and genuine. This is what is presently occurring in the US, and a decline in oil prices will not halt this dynamic for now. Only higher US unemployment will lead to a meaningful deceleration in wage growth. Consistent with broadening US inflation, trimmed-mean and median CPIs have accelerated and reached 6-7%, even though core CPI has recently moderated (Chart 12). After having mismanaged inflation in the past 18 months, the Fed will err on the side of tighter policy. The rationale is that the US is already facing surging wages and a very tight labor market. Financial markets are currently underrating this risk. In fact, in its official statement the Fed has asserted that its commitment to bring inflation to its 2% target is unconditional. As we have written extensively, wages and inflation are lagging business cycle variables. Despite the ongoing slowdown in the US economy, it will take many months before the underlying core inflation rate drops below 3.5%. Bottom Line: We maintain that the Fed and the stock market remain on a collision course. In the US, surging wages and easing financial conditions would make the Fed even more committed to tightening policy substantially. The basis for this perspective is that, even if core inflation falls in the coming months, it will still be well above the Fed’s target of 2%. EM/China Growth Outlook Chart 13Global Trade Will Shrink In H2 2022
Global Trade Will Shrink In H2 2022
Global Trade Will Shrink In H2 2022
EM currencies will continue depreciating versus the US dollar as the Fed reinforces its hawkish stance and global growth/EM exports contract. Indicators from Korea and Taiwan that lead global trade suggest that global export volumes are heading into contraction (Chart 13). While lower oil prices are marginally positive for EM energy importers, share prices and currencies of these countries are often driven by their exports. The latter are set to shrink. EM ex-China domestic demand will decelerate because of (1) drastic monetary tightening by their central banks, (2) reduced household purchasing power due to the substantial rise in food and energy prices in their local currency earlier this year (see Chart 5 above), and (3) the unwinding of pandemic fiscal stimulus. Currency depreciation and slumping global and domestic growth will weigh on both EM share prices and credit markets. Chart 14 illustrates that EM sovereign bond yields have continued rising (shown inverted on the chart), which is consistent with lower EM non-TMT equity prices. Chart 14Rising EM USD Bond Yields (Shown Inverted) Point To Lower Share Prices
Rising EM USD Bond Yields (Shown Inverted) Point To Lower Share Prices
Rising EM USD Bond Yields (Shown Inverted) Point To Lower Share Prices
With respect to China, we discussed the country’s new infrastructure stimulus in depth in last week’s report. Our assessment is that this new infrastructure funding will not result in new investments. Rather, it will largely offset the drop in local government (LG) revenues from land sales this year. As for the latest events regarding mortgage boycotts and authorities’ decision to introduce a moratorium on mortgages linked to delayed housing completions, the damage to homebuyers’ confidence has already been done. Given the ongoing turmoil in China’s property market, potential homebuyers will drag their feet. As a result, home sales will be underwhelming, real estate developers will struggle, and construction activity will contract. The top panel of Chart 15 illustrates that home sales have relapsed anew in the first two weeks of July after stabilizing in June. This implies that June’s bounce was a one-off move driven by pent-up demand after lockdowns were eased. Moreover, house prices are deflating (Chart 15, bottom panel). Consistently, Chinese property stocks and offshore corporate bond prices continue to plunge (Chart 16). Chart 15Chinese Housing: Sales And Prices Are Falling
Chinese Housing: Sales And Prices Are Falling
Chinese Housing: Sales And Prices Are Falling
Chart 16Chinese Property Developers: Stock And Bond Prices Continue Plunging
Chinese Property Developers: Stock And Bond Prices Continue Plunging
Chinese Property Developers: Stock And Bond Prices Continue Plunging
All of the above corroborates our thesis that housing construction in China will continue to contract, weighing on raw material demand and prices and, thereby, EM exports. Finally, rolling lockdowns in China will persist as long as the mainland’s stringent dynamic zero-COVID policy remains in place. The number of cities under mobility restrictions or some form of lockdown climbed during the second week of July. Putting it all together, China’s private sector sentiment remains in the doldrums. The willingness to spend or invest among households and enterprises will remain depressed. This will ensure that the multiplier effect of the fiscal and credit stimulus will be small. Bottom Line: Not only will EM/China exports contract but their domestic demand will also struggle. These dynamics, in combination with a hawkish Fed, are bearish for EM currencies, credit markets and equities. Investment Conclusions Chart 17EM Domestic Bonds: Do Not A Catch Falling Knife
EM Domestic Bonds: Do Not A Catch Falling Knife
EM Domestic Bonds: Do Not A Catch Falling Knife
Global risk assets are oversold, and investor sentiment is pessimistic. In this context, a technical equity rebound cannot be ruled out. However, we do not think it will be the beginning of a major cyclical rally. As the US dollar continues to overshoot, EM will underperform DM equities, and EM credit markets will underperform US credit markets on a quality-adjusted basis. An underweight position in EM in global equity and credit portfolios is warranted. With respect to EM local currency bonds, we remain on the sidelines as near-term risks are still elevated (Chart 17). For now, we prefer to bet on yield curve flattening. Our favorite markets for flatteners are currently Mexico and Colombia. We continue to short the following currencies versus the USD: ZAR, COP, PEN, PLN, PHP, and IDR. In addition, we recommend shorting HUF vs. CZK, and KRW vs. JPY. Arthur Budaghyan Chief Emerging Markets Strategist arthurb@bcaresearch.com Footnotes 1 Special Drawing Rights are the IMF’s synthetic currency – we use it as a proxy for the global average currency. Strategic Themes (18 Months And Beyond) Equities Cyclical Recommendations (6-18 Months) Cyclical Recommendations (6-18 Months)