United States

Table 1
Q2-2022 Earnings Commentary
Q2-2022 Earnings Commentary
Q2-22 reporting season is of paramount importance for investors as it may help shape market expectations into the balance of the year. After all, the multiples compression stage of the bear market, driven by entrenched inflation and monetary tightening, is likely complete. Now all eyes are on the growth and the ability of the companies to navigate the economy that is being slowed down by the Fed. The following is a quick snapshot of the results and expectations: As of July 20th, 60 S&P 500 companies have reported. According to Refinitiv, the S&P 500 EPS is expected to grow at 5.9% this quarter based on the expectations and the early results (blended). Excluding the Energy sector, the blended growth rate drops to -3.5% (Table 1). The S&P 500 blended sales growth is expected to be 11.2%. Excluding Energy, the rate falls to -3.9% (Table 1). 24 of the 60 companies that have reported are in the Financials sector, making it the only sector with a “critical mass” of results (24 out 42 in the sector). So far, the Financials sector has delivered a sales surprise of 1.3%, and an earnings surprise of 4.2% with 75% of companies beating analyst earnings expectations. The caveat here is that the bar for the sector has been set low, with analysts expecting earnings to contract by 21.7%. Some initial thoughts: Sales growth expectations by far exceed earnings growth expectations, signaling margins compression, and exacerbating trends that have started in Q1-2022. We have anticipated 2022 margins compression in the “Marginally Worse” report back in October 2021. So far corporate results have been reassuring, with a high share of companies beating both sales and earnings expectations. However, it is too early to draw far-reaching conclusions. On a positive note, the largest US banks have reported that their Net Income Margins (NIM) have expanded and describe US consumers as “healthy”. However, there are some red flags and negative guidance: Most banks have increased non-performing loan reserves which reflect their concerns about slowing growth and deteriorating credit conditions. Companies are reporting the adverse effects of withdrawing from Russia – IBM. The largest technology companies have announced hiring slowdowns on the back of the weakening demand for their products and overall concerns about the economy – Apple, Google, Amazon Companies across the board are mentioning the negative effects of dollar appreciation on their earnings from abroad – Microsoft pre-announcement, Johnson & Johnson, Pepsico, IBM, Halliburton, Netflix Slowdown in demand for chips – Micron, Nvidia Forward guidance has also been concerning. Most companies talk about deteriorating economic conditions. Chart 1
CHART 1
CHART 1
Despite the negative commentary summarized above, so far earnings have been strong. Then why are we worried about corporate earnings? First, analysts are still forecasting earnings to grow at about a 10% rate over the next 12 months despite ubiquitous negative corporate guidance. As Chart 1 highlights, most of that EPS growth is expected to come in Q3-22, which implies that over the next several months at least some of the macro headwinds (slowing growth, the hawkish Fed, stubborn inflation, energy crisis, and rising wages) will dissipate. We don’t consider this to be a high probability outcome as we are now halfway through the quarter, and macroeconomic conditions are not improving. Moreover, analysts themselves have little confidence in their own forecasts as is evident in the elevated earnings uncertainty (Chart 2). In all likelihood, downgrades are on the way. Second, our earnings growth regression model indicates that earnings growth is slowing, and earnings recession is likely within six months or so (Chart 3). Chart 2
CHART 2
CHART 2
Image
Bottom Line: We continue to recommend that investors remain patient and prudent in the range-bound markets. Earnings growth is likely to deteriorate into the year end.
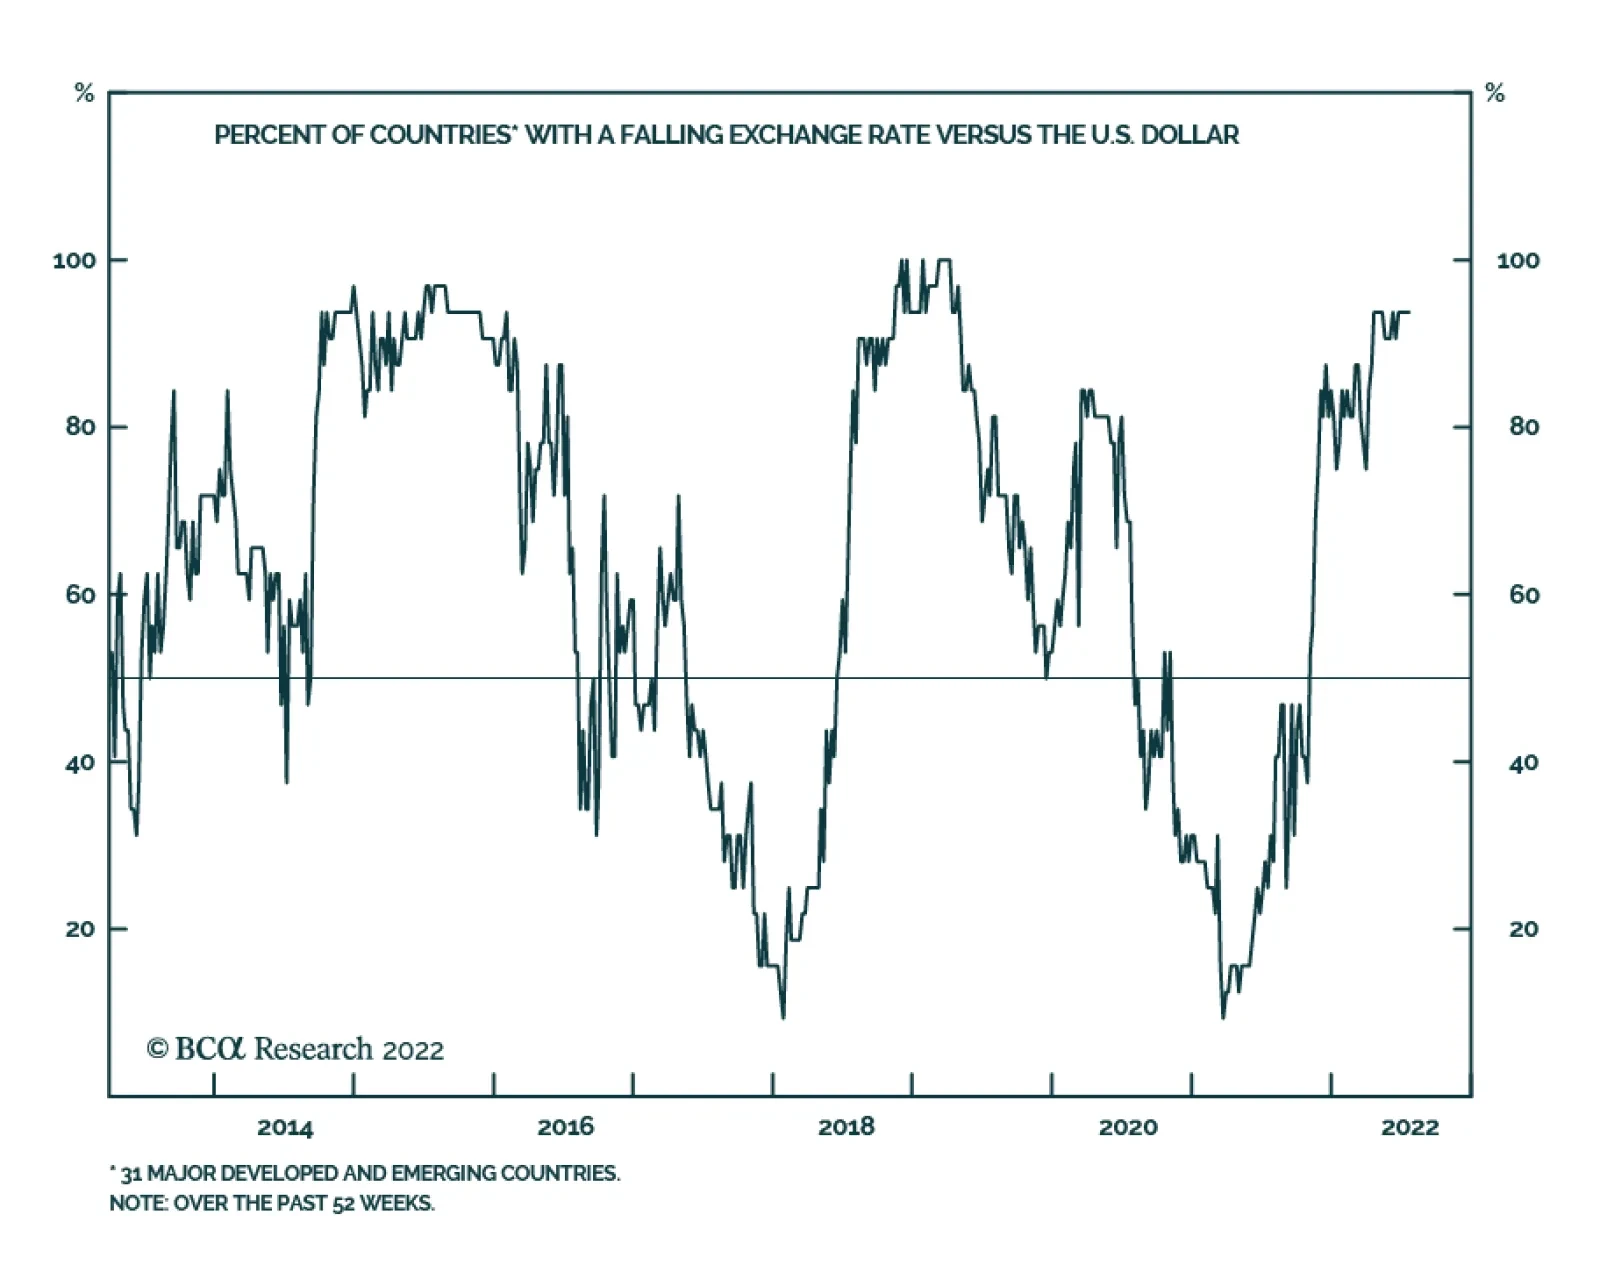
The trade weighted dollar index’s 7% gain so far this year underscores the broad-based nature of USD strength. In fact, nearly all currencies have been falling versus the US dollar over the past several months. The implication is that most of the factors that…
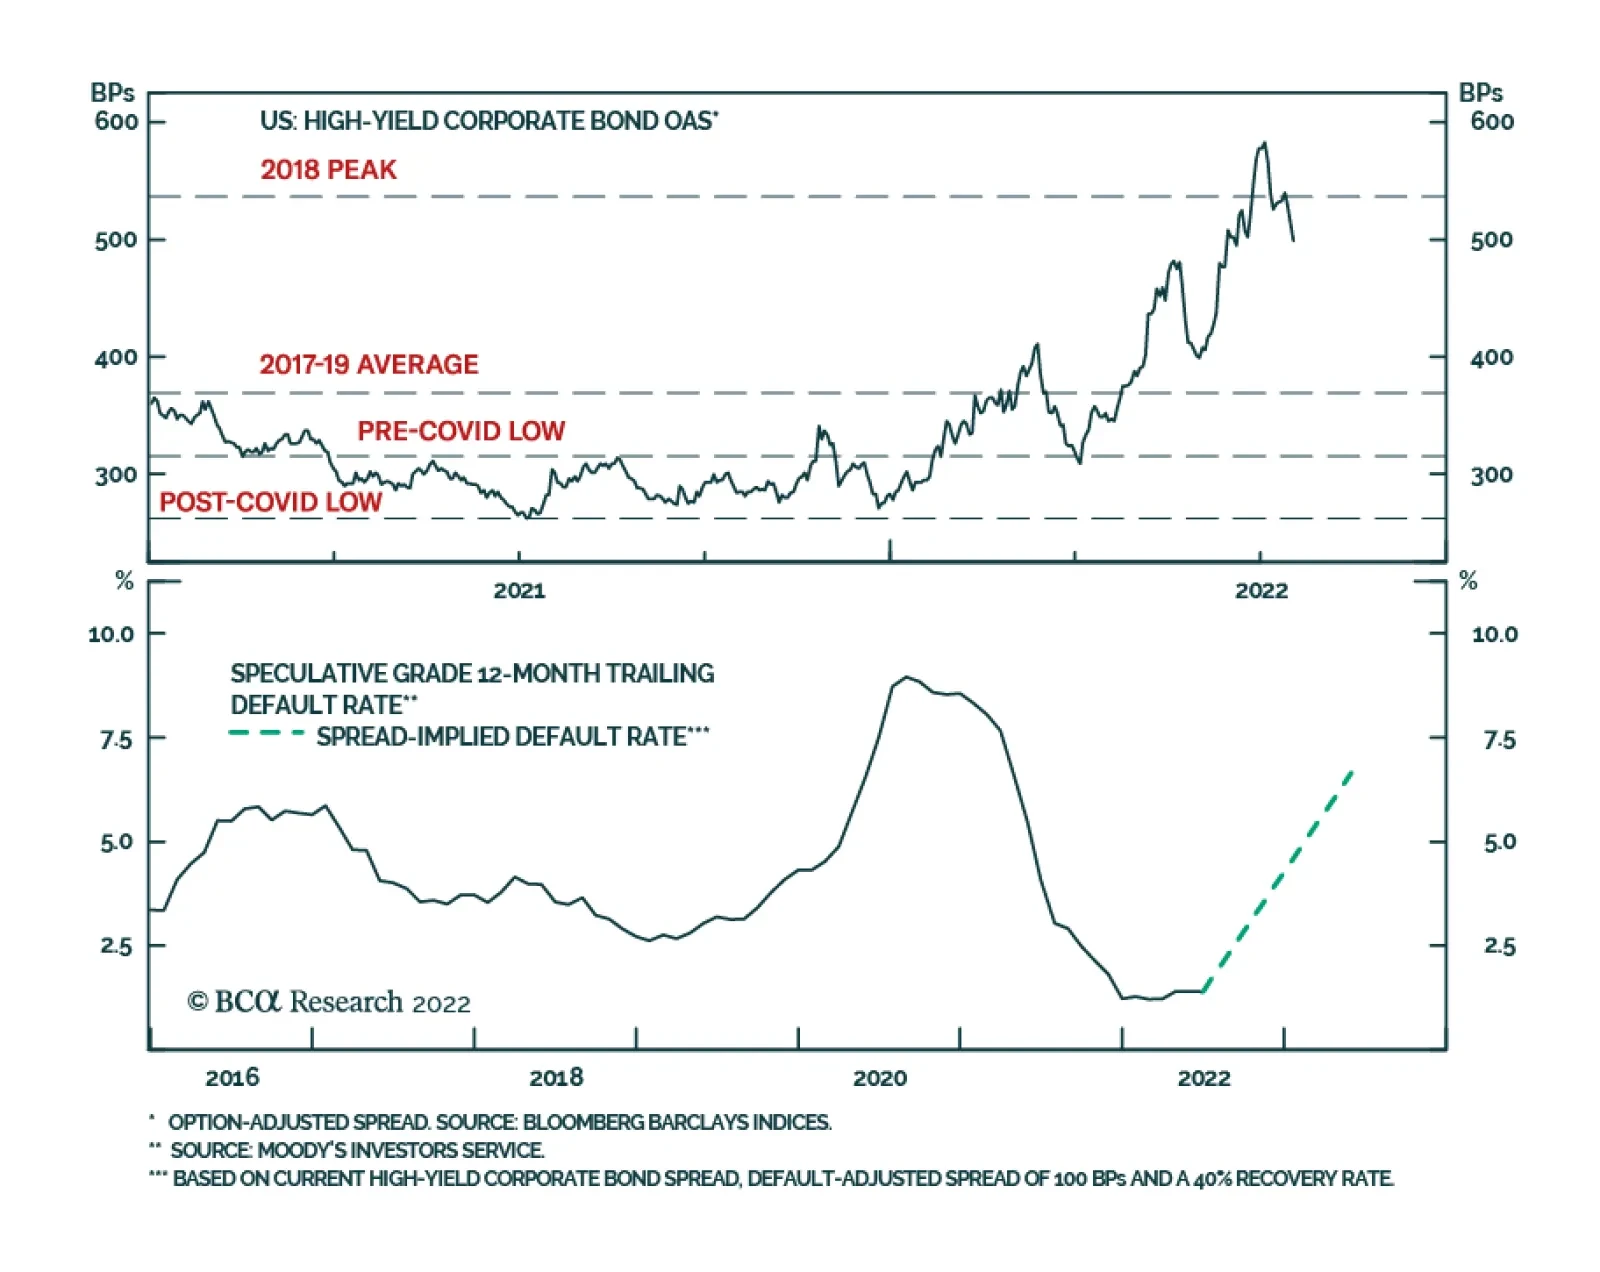
US junk bond spreads have been narrowing for the past two weeks, falling back below the 2018 peak. Interestingly, this trend is occurring despite the Fed’s aggressively hawkish stance and ongoing recession fears weighing on the outlook for corporate defaults.…
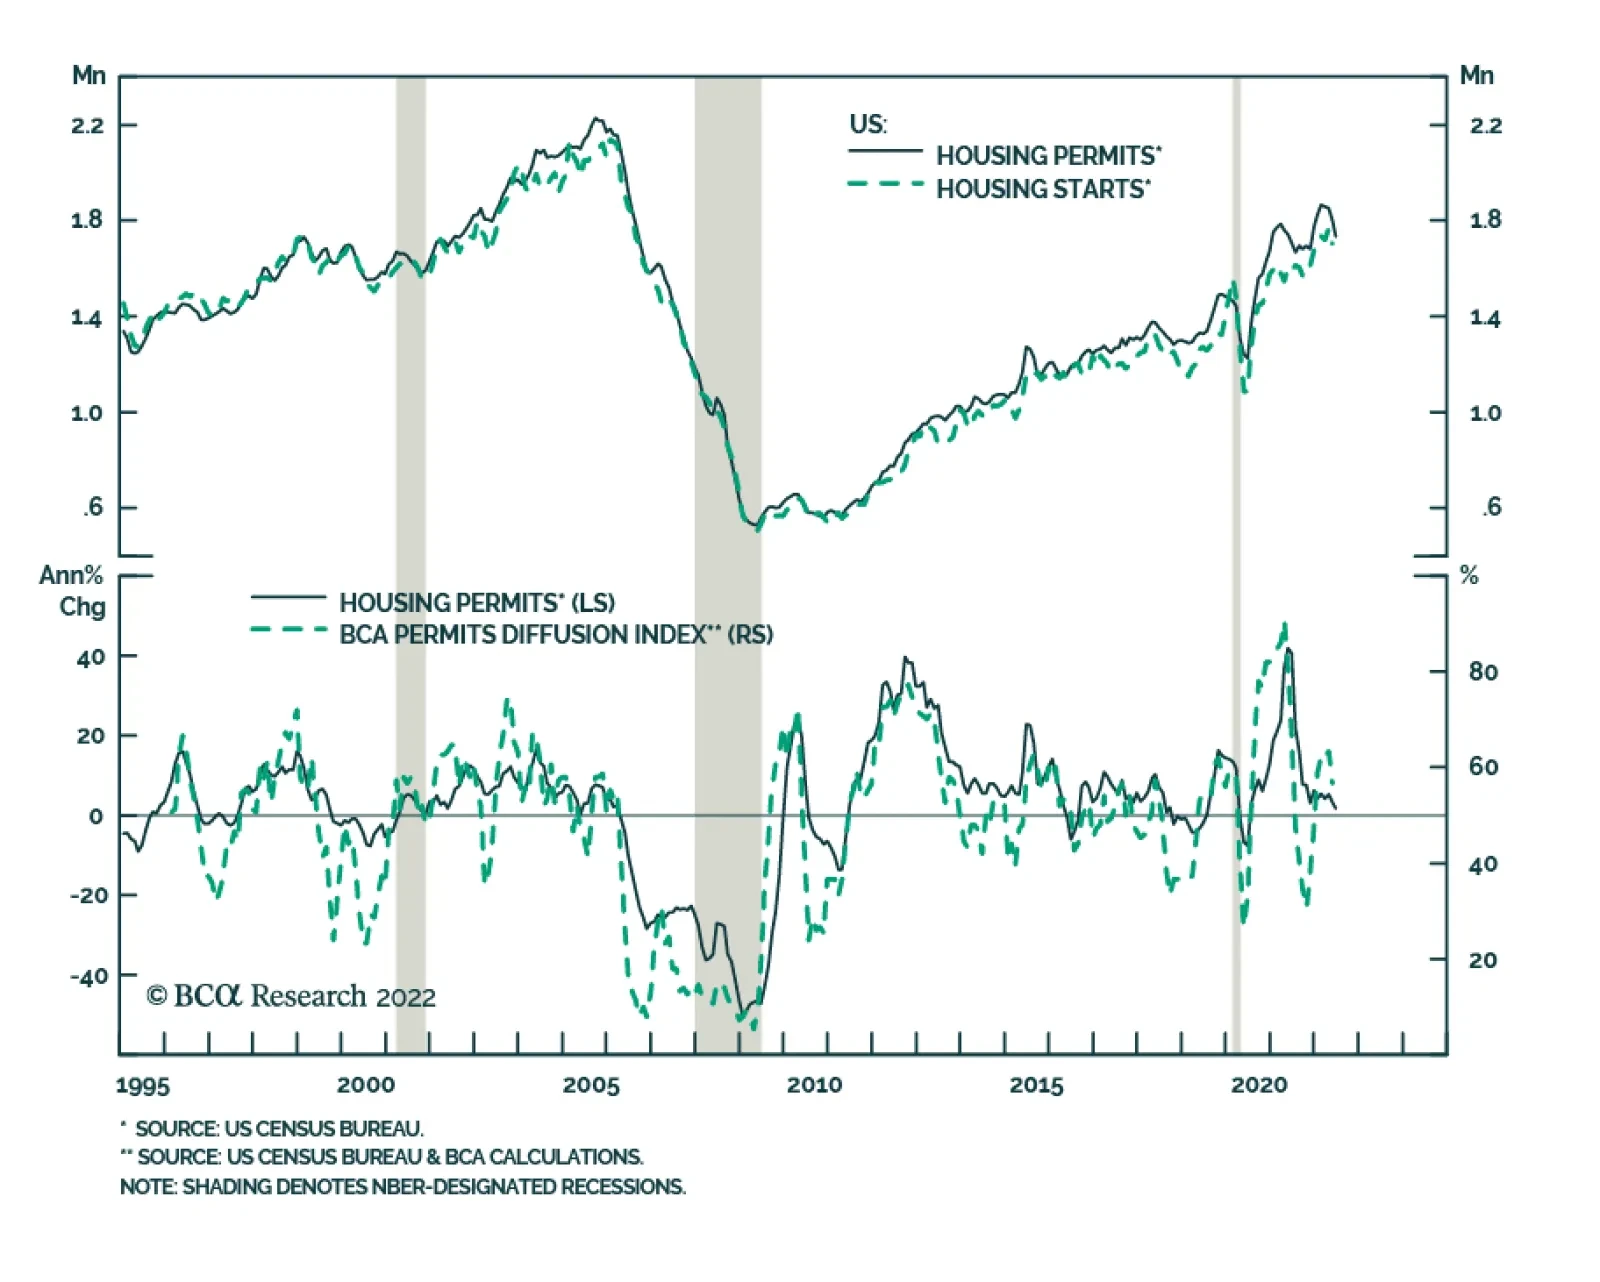
US housing starts surprised to the downside on Tuesday. They fell by 2% m/m in June, disappointing expectations they would firm. This release follows Monday’s NAHB survey showing a significant deterioration in homebuilder sentiment. That said, the housing…
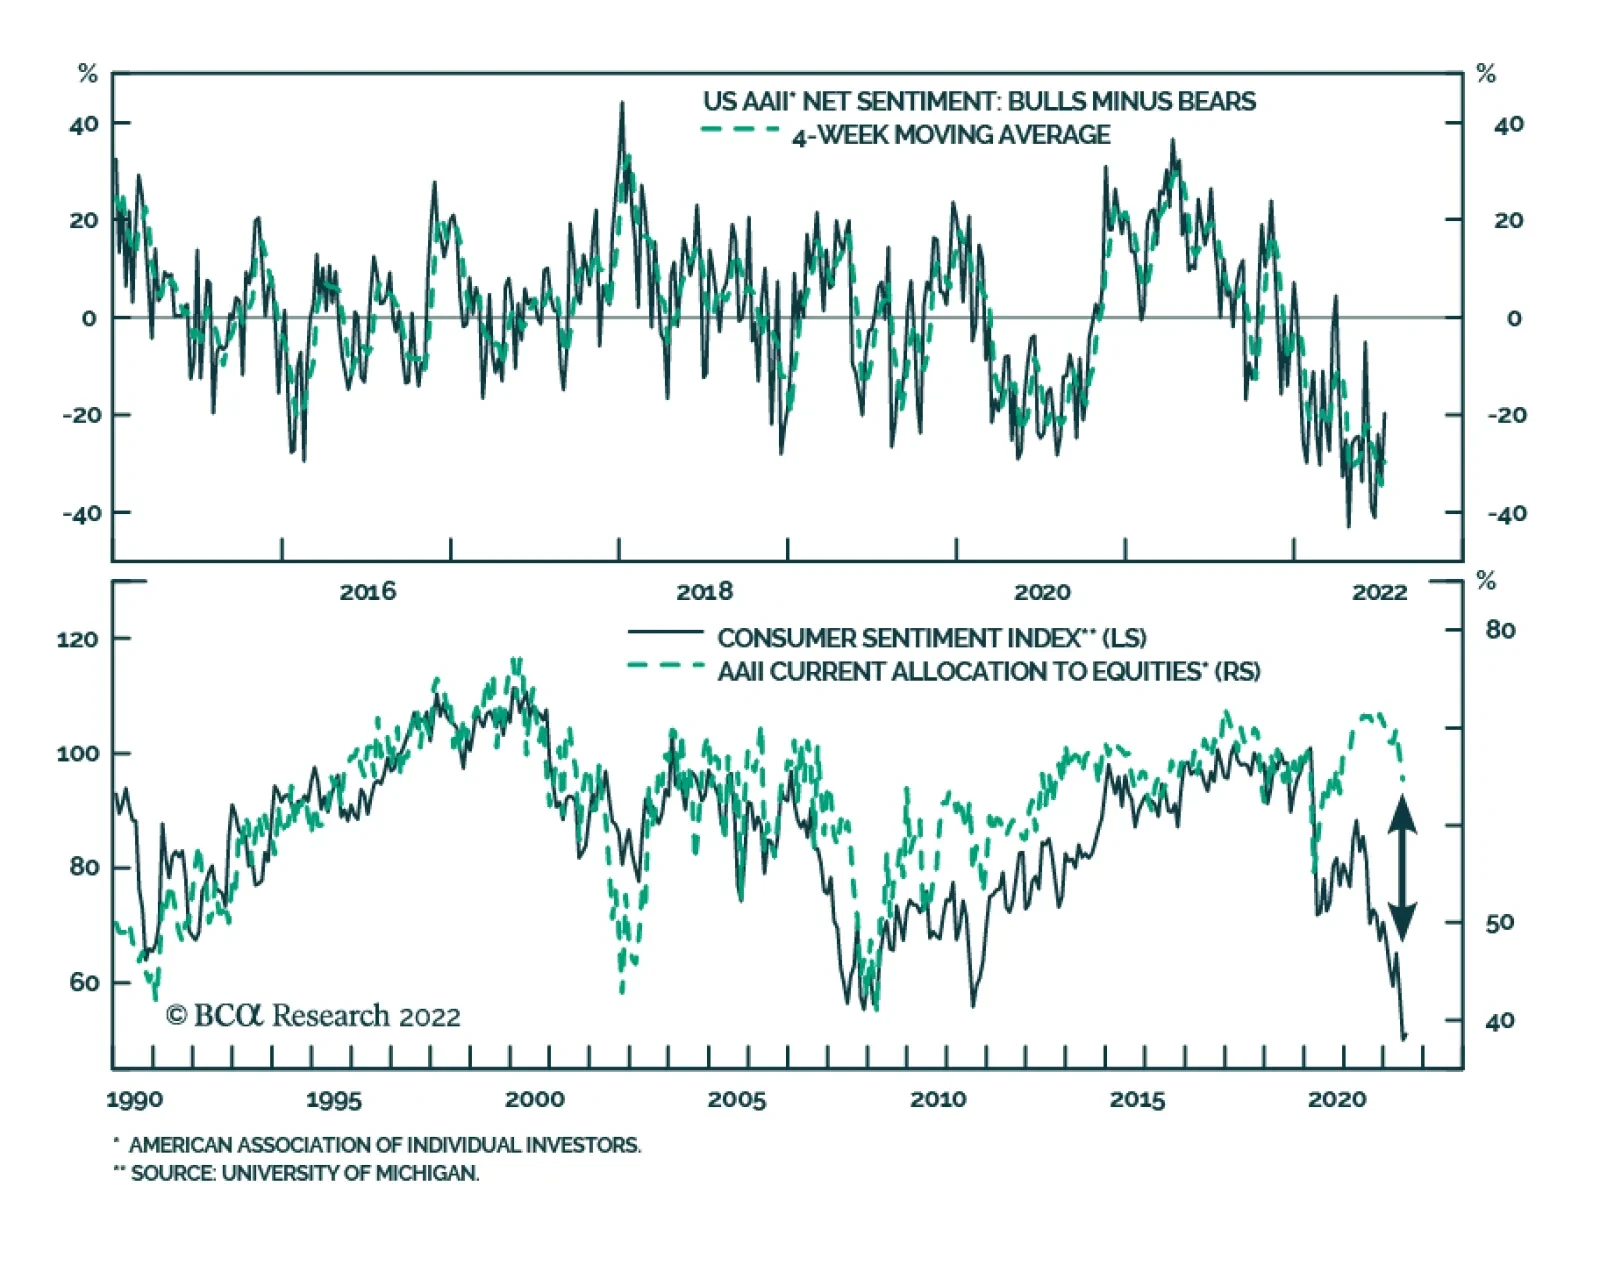
According to the latest Bank of America monthly fund manager survey, investors’ allocation to stocks collapsed to lows not seen since October 2008. Similarly, exposure to cash is now at the highest level since 2001 and a net 58% of respondents reported taking…
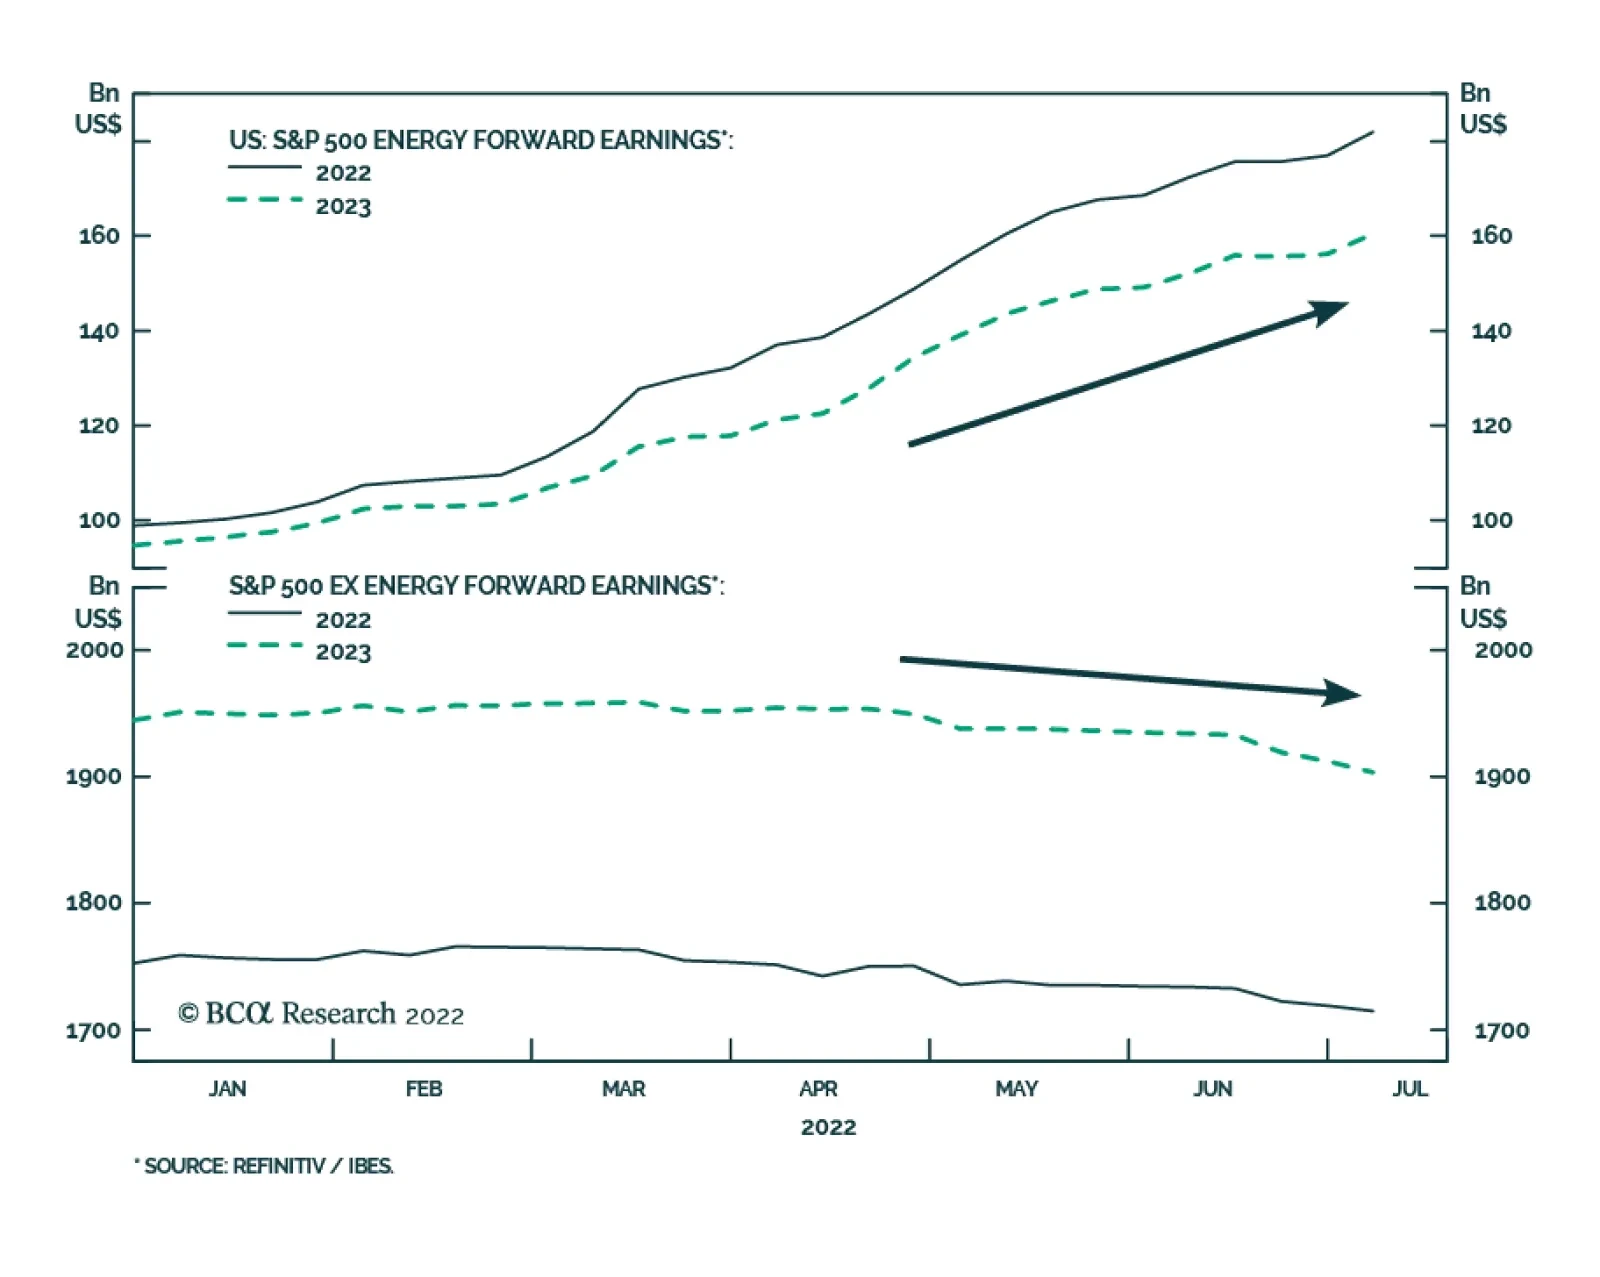
Valuations are largely responsible for the year-to-date equity selloff. Meanwhile, earnings estimates have remained relatively resilient even though global growth has slowed globally. Two factors explain this earnings puzzle. First, soaring energy…
According to BCA Research’s US Bond Strategy service, inflation has an easy path back to 4%, but a move to 2% will require a higher unemployment rate. At 5.9%, core CPI inflation is running well above the Fed’s 2% target. However, we know that some portion…
Executive Summary We posit three conjectures about the US economy: Inflation has an easy path back to 4%, but a move to 2% will require a higher unemployment rate. It will be more difficult to raise the unemployment rate than many anticipate. The Fed will tolerate a higher unemployment rate than many anticipate. Taken together, these conjectures point to a higher fed funds rate in 2023 than is currently discounted in the market. This suggests that investors should be bearish bonds on a 12-18 month investment horizon. While we are bearish bonds in the medium-to-long term, we retain an ‘at benchmark’ portfolio duration stance for the time being because numerous indicators point to lower bond yields during the next few months. We also recommend an underweight allocation to spread product versus Treasuries, though we highlight the potential for solid near-term junk bond returns. Rate Expectations: Market Versus Fed
Rate Expectations: Market Versus Fed
Rate Expectations: Market Versus Fed
Bottom Line: Maintain an ‘at benchmark’ portfolio duration stance. We will recommend reducing portfolio duration if the 10-year Treasury yield falls to 2.5% or if core inflation converges with our 4%-5% estimate of its underlying trend. Feature Uncertainty in bond markets remains elevated as investors seemingly can’t decide whether the US economy is in the midst of an inflationary boom or hurtling towards recession. This week’s report details our view of the current macroeconomic environment by offering three conjectures about the state of the US economy and monetary policy. We conclude by explaining how these conjectures shape our recommended investment strategy. Conjecture #1: Inflation Has An Easy Path Back To 4%, The Path To 2% Will Be More Difficult At 5.9%, core CPI inflation is running well above the Fed’s 2% target. However, we know that some portion of that 5.9% reflects supply side constraints related to the pandemic and some portion reflects an overheating of the demand side of the US economy. This distinction is important because the pandemic-related inflation will eventually subside on its own, without the need for materially slower economic growth. In contrast, a significant economic slowdown and a higher unemployment rate will be required to tame any inflation driven by strong US demand. Chart 1Estimating Trend Inflation
Estimating Trend Inflation
Estimating Trend Inflation
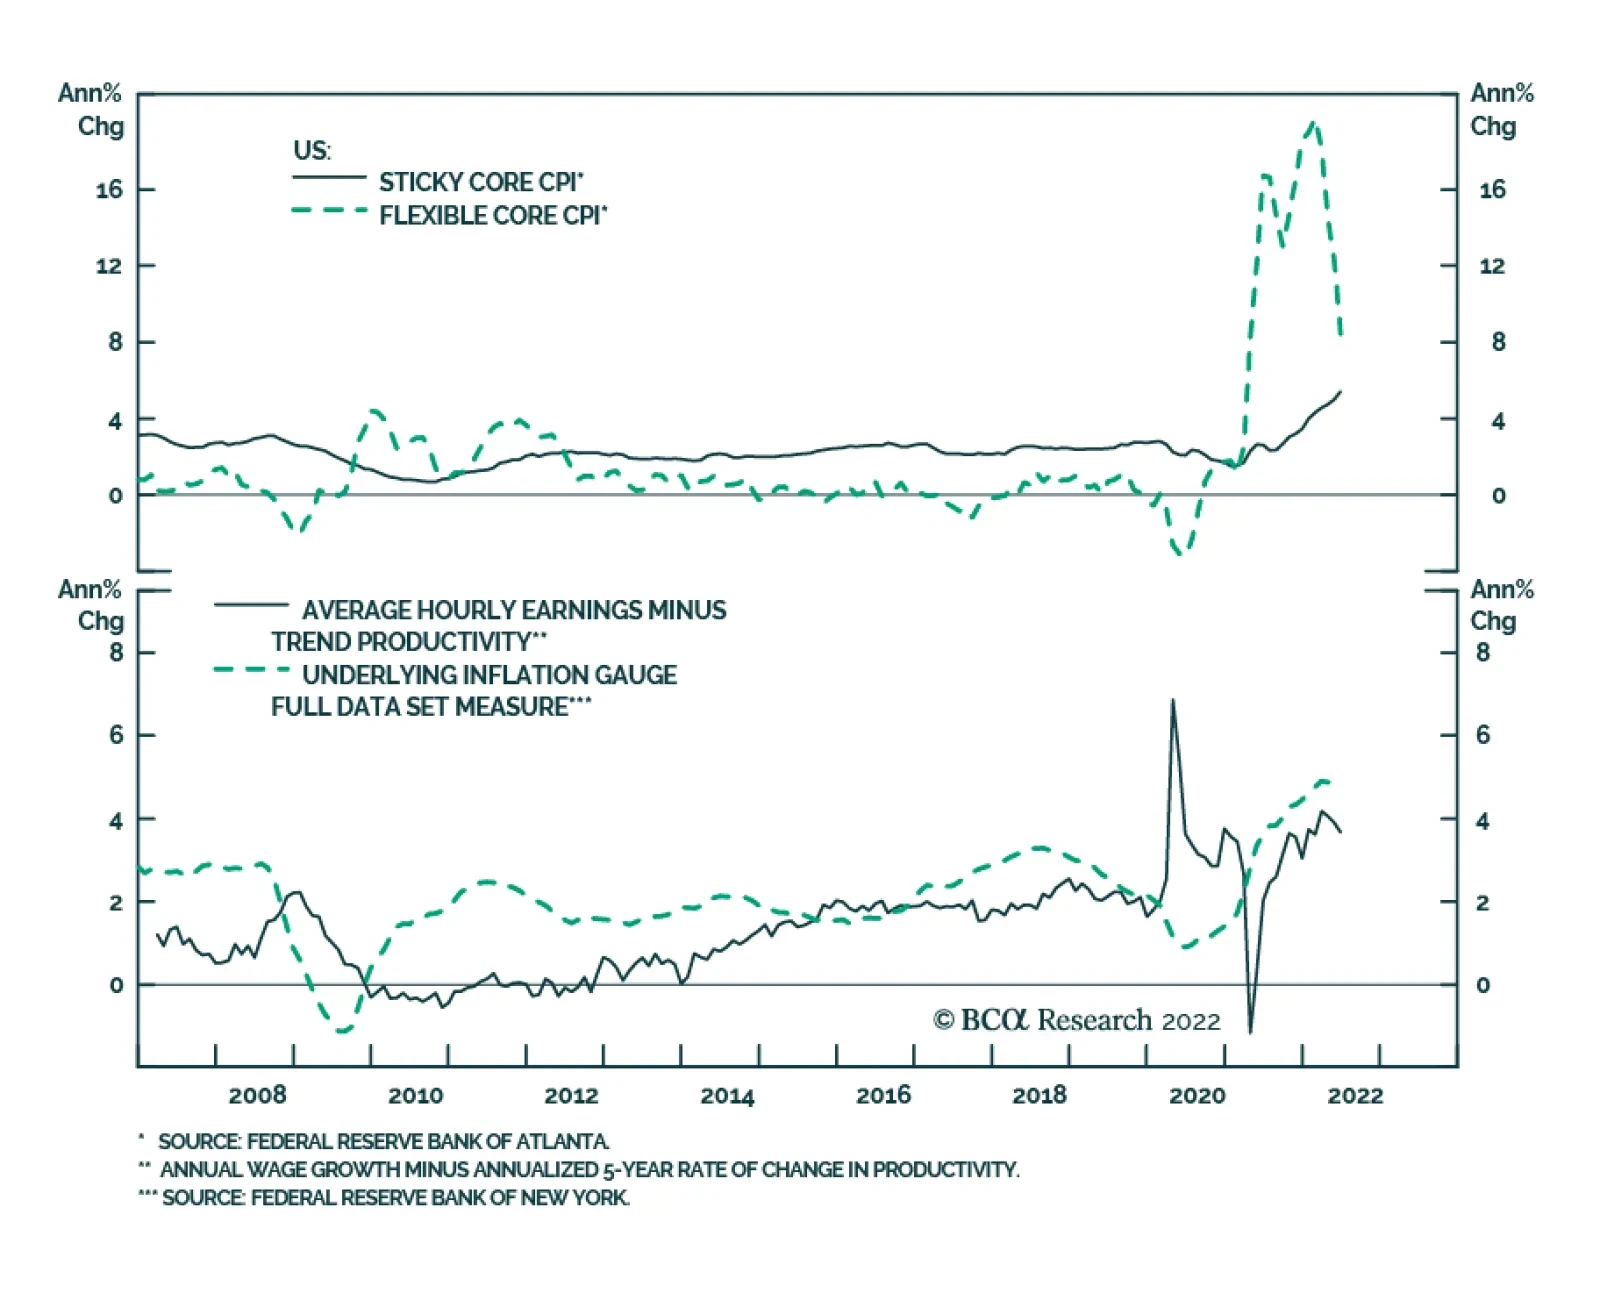
In a recent report we looked at three different techniques for distinguishing between these two types of inflation.1First, we considered the Atlanta Fed’s decomposition of core inflation into flexible and sticky components. At present, the volatile core flexible CPI is running at an 8.4% annual rate and the core sticky CPI stands at 5.4% (Chart 1). Second, we noted that the New York Fed’s Underlying Inflation Gauge is running at 4.8% (Chart 1, bottom panel). Finally, we used wage growth net of trend productivity growth as an estimate of inflation’s underlying trend and calculated that to be 3.7% (Chart 1, bottom panel). From this analysis, our general conclusion is that core CPI inflation can fall into a range of 4%-5% just from the unwinding of pandemic-induced supply-side effects. After that, the Fed will be forced to engineer an economic slowdown to bring inflation from the stickier 4% level back down to its 2% target. Inflation Progress Report Last week’s June CPI report shows that even progress back to our 4%-5% estimate of inflation’s underlying trend is proving difficult. Core CPI rose 0.71% in June, well above expectations, and monthly trimmed mean CPI was an even stronger 0.80% (Chart 2A). Base effects led to a small drop in the annual core CPI number – from 6.0% to 5.9% - but annual trimmed mean CPI moved up to 6.9% (Chart 2B). The strong CPI print has led to increased speculation that the Fed will raise rates by 100 bps this month (see Box). Chart 2AMonthly Inflation
Monthly Inflation
Monthly Inflation
Chart 2BYearly Inflation
Yearly Inflation
Yearly Inflation
Turning to the three major components of core inflation, we see that shelter, goods, and services ex. shelter contributed roughly equal amounts to the June core CPI reading (Chart 3). The elevated reading from core goods inflation is particularly notable because this is one area where we have been anticipating that easing supply-side constraints will send prices lower. Car prices, specifically, have been one of the principal drivers of high inflation and they remained stubbornly high in June (Chart 4). Chart 3Monthly Core CPI Inflation By Major Component
Three Conjectures About The US Economy
Three Conjectures About The US Economy
Chart 4Contribution To Month-Over-Month Core Goods CPI
Three Conjectures About The US Economy
Three Conjectures About The US Economy
Chart 5Supply-Side Constraints Are Easing
Supply-Side Constraints Are Easing
Supply-Side Constraints Are Easing
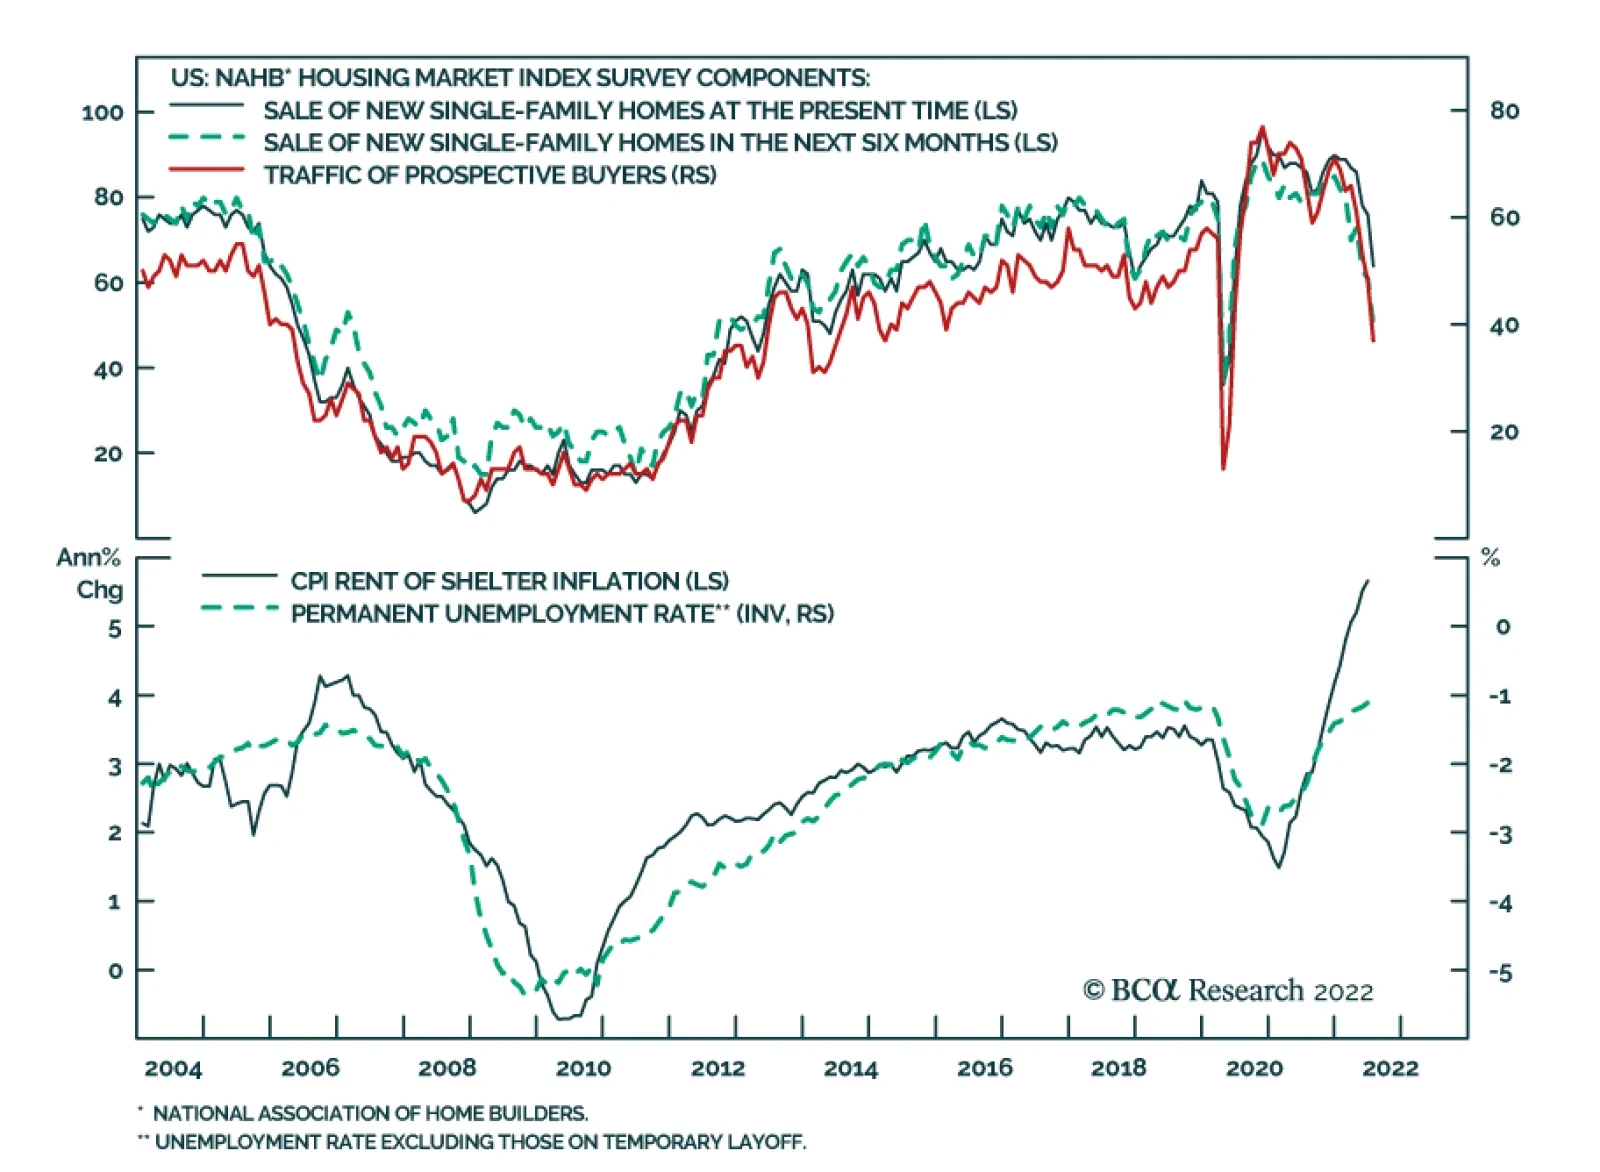
While it has taken much longer than expected for core goods and other pandemic-driven components of inflation to turn down, leading indicators still suggest that these prices are more likely to fall than rise during the next few months. The New York Fed’s Global Supply Chain Pressure Index has clearly rolled over and supplier delivery times, as measured by both the ISM manufacturing and non-manufacturing surveys, have shortened (Chart 5). While core goods and autos are representative of the sort of inflation that will ease naturally as supply chain constraints abate, shelter inflation is representative of the sort of inflation that will be stickier. That is, a higher unemployment rate will be required to significantly lower shelter inflation. Chart 6Shelter CPI Model
Shelter CPI Model
Shelter CPI Model
Shelter inflation, currently running at 5.6%, can be modeled using the unemployment rate, rental vacancies and home prices (Chart 6). Given that shelter is such a large component of core inflation, it must fall if the Fed is going to achieve its 2% inflation target. That will certainly require a higher unemployment rate and very likely a recession. Bottom Line: Core inflation will move down in the second half of this year, as easing supply-side constraints lead to lower goods prices. Inflation’s downtrend will subside once it reaches its trend level of 4%-5%, at which point a higher unemployment rate and economic recession will be required to move it even lower, back to the Fed’s 2% target. BOX 75 bps Or 100 bps At The Next FOMC Meeting? Guidance provided by Fed Chair Jay Powell at the last meeting FOMC meeting suggested that the committee will choose between lifting rates by 50 bps or 75 bps when it meets later this month. The implication was that any negative inflation surprise would push the committee towards 75 bps. Certainly, last month’s strong employment report and hot CPI print justify a 75 bps move within Powell’s framework. But is it possible that Powell’s guidance from the June FOMC meeting is already stale? Chart B1July FOMC Expectations
July FOMC Expectations
July FOMC Expectations
Investors are increasingly betting that it is, and the market is now discounting some chance of a 100 bps rate hike this month (Chart B1). The reason for this pricing is that the Fed has already backtracked on its guidance once before. Powell ruled out 75 bps rate hikes at the May FOMC press conference. Then, the committee delivered a 75 bps increase in June after core CPI came in hot. Kansas City Fed President Esther George dissented from the June decision because she objected to the Fed flip-flopping on its guidance so quickly. George explained her dissent in a recent speech by saying that “communicating the path for interest rates is likely far more consequential than the speed with which we get there.”2 Where does this leave us for the July meeting? Our expectation is that the Fed will stick to its guidance and deliver a 75 bps increase this month. However, if the market moves to fully price-in a 100 bps move then the committee may be tempted to deliver on those expectations. In other words, the Fed’s recent track record of abandoning its forward rate guidance means that both a 75 bps rate hike and a 100 bps rate hike are in play for July. Conjecture #2: The Labor Market Will Be More Resilient Than Is Widely Believed Chart 7An Extremely Tight Labor Market
An Extremely Tight Labor Market
An Extremely Tight Labor Market
Our second conjecture is that it will be more difficult to lift the unemployment rate than many people think. This view stems from the fact that the labor market is incredibly tight. As Fed officials have often pointed out, there are currently almost two job openings for every unemployed worker in the country (Chart 7). Further, we noted in last week’s report that while the employment readings from both ISM surveys are in contractionary territory, respondents to those surveys were much more likely to cite concerns about the supply side of the labor market than they were to cite concerns about hiring demand.3 In other words, an economy where there are twice as many job openings as unemployed workers and where firms are complaining about a shortage of labor is not one where we are likely to see an immediate surge in layoffs, even as demand starts to soften. Conjecture #3: The Fed Will Tolerate A Higher Unemployment Rate Than Is Widely Believed Chart 8Optimal Control Monetary Policy
Optimal Control Monetary Policy
Optimal Control Monetary Policy
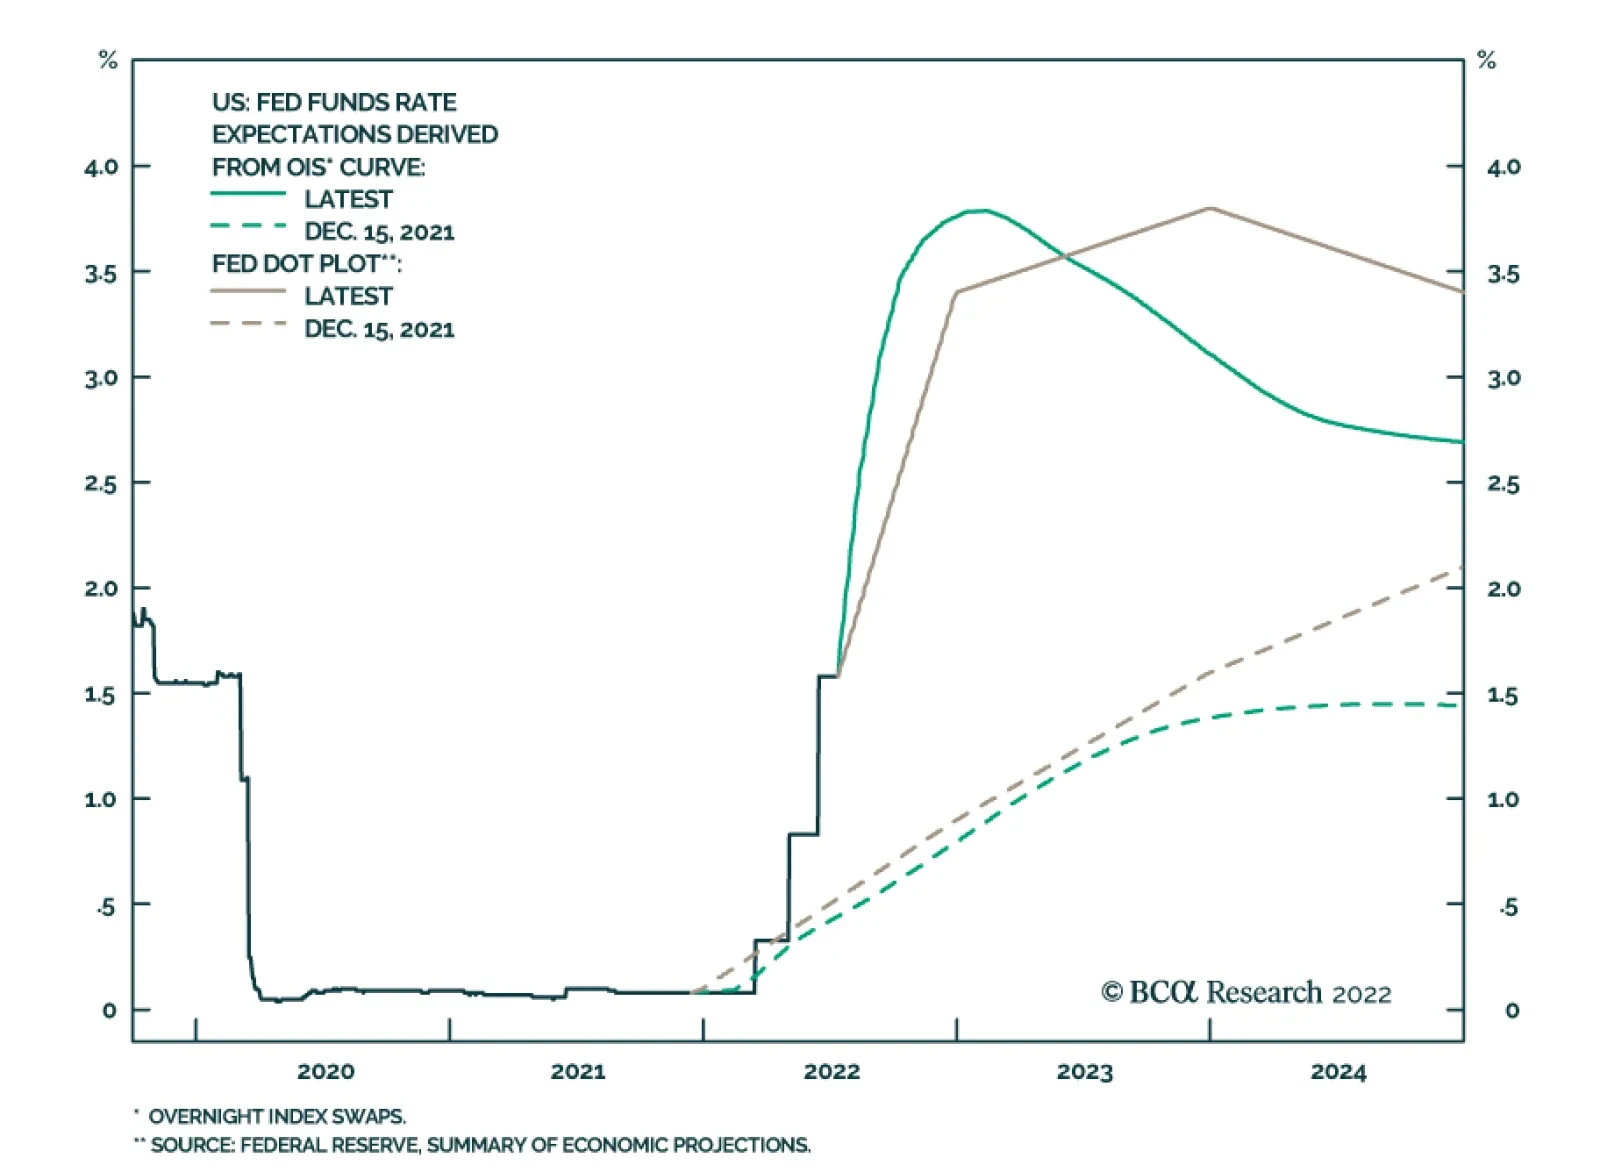
Our final conjecture is that the Fed will persistently run a much more restrictive monetary policy than many investors anticipate. We detailed our logic in a recent report where we argued that the Fed will adopt an optimal control approach to monetary policy.4 An optimal control strategy is employed when the Fed is unlikely to perfectly hit both its full employment goal and its 2% inflation target. In such environments, Janet Yellen has argued that the Fed should set monetary policy to minimize the joint deviations of inflation from target and of the unemployment rate from estimates of its full employment level.5 Chart 8 presents an example of an optimal control loss function that consists of adding together the squared deviations of inflation from 2% and of the unemployment rate from the Congressional Budget Office’s estimate of NAIRU. Using this framework, the Fed’s goal is to minimize the output of the loss function shown in the top panel. The dashed lines in Chart 8 illustrate a scenario where core PCE inflation falls to 4% but where the output from the loss function is held flat. That scenario implies an increase in the unemployment rate from its current level of 3.6% all the way up to 6.7%! This exercise demonstrates that, under an optimal control framework, the Fed would be willing to tolerate an unemployment rate of 6.7% or lower in order to move core inflation back to 4%. We don’t see the unemployment rate hitting 6.7% any time soon. The main point of this analysis is to illustrate that Fed policy is likely to retain a restrictive bias until inflation returns to 2% or lower. It won’t move toward easing policy at the first sign of a higher unemployment rate, as has been the pattern in recent years when inflation was much more contained. Investment Implications To summarize, our three conjectures about the US economy are that: (i) a higher unemployment rate will be required to move inflation from 4% to the Fed’s 2% target, (ii) a lot of demand destruction will be required before we see a significant rise in the unemployment rate and (iii) in its pursuit of lower inflation, the Fed will tolerate a higher unemployment rate than many people expect. Taken together, these three conjectures imply that the fed funds rate will be higher in 2023 than what is currently priced in the curve. At present, the market is priced for the fed funds to peak at 3.67% in March 2023 and then fall back to 3.13% by the end of the year (Chart 9). If our three conjectures pan out, then we think it’s likely that the fed funds rate will move above 4% next year and that it will be higher than 3.13% by the end of 2023. Chart 9Rate Expectations: Market Versus Fed
Rate Expectations: Market Versus Fed
Rate Expectations: Market Versus Fed
Portfolio Duration Chart 10High-Frequency Bond Yield Indicators
High-Frequency Bond Yield Indicators
High-Frequency Bond Yield Indicators
Obviously, this view makes us inclined toward a ‘below-benchmark’ portfolio duration stance on a 12-18 month investment horizon. That said, we recommend keeping portfolio duration close to benchmark for now because many indicators suggest that bond yields could fall during the next few months (Chart 10). More specifically, with core CPI still above our 4%-5% estimate of its underlying trend, we see inflation as more likely to fall than rise during the next six months. At the same time, aggregate demand will be slowing as the Fed tightens policy and the unemployment rate is more likely to rise than fall. These factors will keep bond yields contained between now and the end of the year. While we recommend an ‘at benchmark’ portfolio duration stance on a 6-12 month horizon, we will reduce portfolio duration if the 10-year Treasury yield moves back to 2.5% or once core inflation converges to our 4%-5% estimate of trend. At that point, we think inflation will be stickier and it will make sense to position for higher bond yields. Spread Product Our three conjectures also imply a negative environment for spread product. Monetary policy will become increasingly restrictive, and it will be a long time before the Fed moves toward interest rate cuts – the traditional signal to pile into spread product. We therefore advocate an underweight allocation to spread product versus Treasuries in US bond portfolios. One exception to our underweight spread product allocation is that we retain a neutral allocation to high-yield. Our reasoning is that high-yield spreads are elevated and they have the potential to tighten during the next few months as inflation converges toward our estimate of trend. As inflation falls and fears of immediate recession abate, it’s conceivable that junk spreads could revert to their 2017-19 average, the level that prevailed during the previous tightening cycle (Chart 11), and such a move would lead to roughly 8.4% of excess return.6 If such a move were to occur within the next six months, then we would be inclined to reduce our junk bond exposure to underweight. A Quick Note On 2-Year TIPS Chart 11Junk Spreads Are Elevated
Junk Spreads Are Elevated
Junk Spreads Are Elevated
Chart 122-Year TIPS Yield Is Positive
Three Conjectures About The US Economy
Three Conjectures About The US Economy
In last week’s report we recommended upgrading TIPS from underweight to neutral relative to duration-matched nominal Treasuries. However, given that the 2-year TIPS yield was still negative, we did not close our recommendation to short 2-year TIPS or our recommended 2/10 real yield curve flattener and 2/10 inflation curve steepener positions. The 2-year real yield has continued to rise during the past week and, at +9 bps, it is now in positive territory (Chart 12). We were confident that the 2-year TIPS yield would turn positive because the Fed has implied that it is targeting positive real yields across the entire curve. But now that the yield is positive, we are no longer confident in the trade’s upside. Bottom Line: Investors should close out their short 2-year TIPS positions, as well as their 2/10 real yield curve flatteners and 2/10 inflation curve steepeners. Ryan Swift US Bond Strategist rswift@bcaresearch.com Footnotes 1 Please see US Bond Strategy / Global Fixed Income Strategy Weekly Report, “No End In Sight For Fed Tightening”, dated June 21, 2022. 2 https://www.kansascityfed.org/Speeches/documents/8875/2022-George-MidAm… 3 Please see US Bond Strategy / Global Fixed Income Strategy Weekly Report, “A Low Conviction US Bond Market”, dated July 12, 2022. 4 Please see US Bond Strategy Weekly Report, “When The Dual Mandates Clash”, dated June 28, 2022. 5 https://www.federalreserve.gov/newsevents/speech/yellen20120606a.htm 6 Return estimate assumes default losses of 1.8% and that the spread tightening occurs over a six month period. Recommended Portfolio Specification Other Recommendations Treasury Index Returns Spread Product Returns
The NAHB Housing Market Index, which measures sentiment among US homebuilders, dropped by a greater-than-expected 12 points to 55 in July, the lowest level since May 2020 and the second largest single-month drop in the index's 37-year history. All three…
According to the FOMC’s latest Summary of Economic Projections, the Fed expects to raise interest rates to 3.4% and 3.8% by the end of 2022 and 2023, respectively. Policymakers are determined to do whatever it takes to tackle inflation. Indeed, at last…