United States
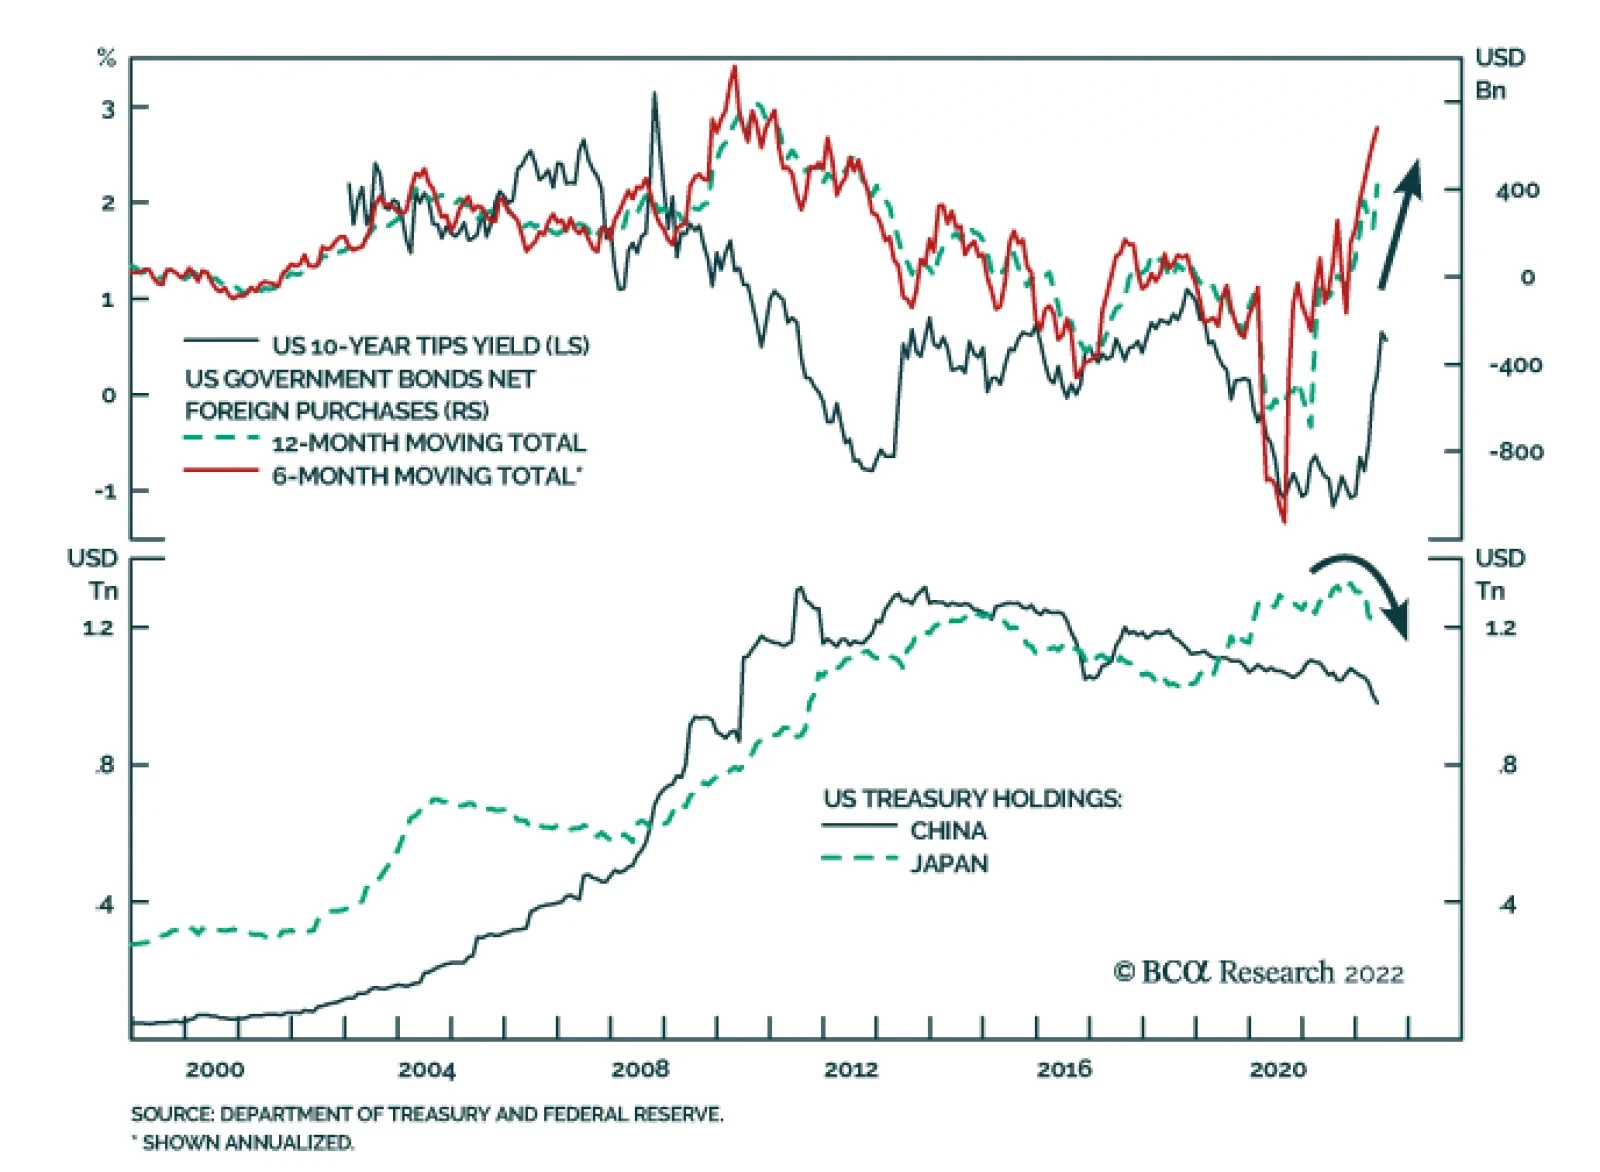
Even though Japan and China – the top foreign owners of US government debt – have been reducing their holdings of US Treasurys, net foreign purchases of US Treasurys have been surging. This dynamic is relevant as our FX strategists have highlighted massive…
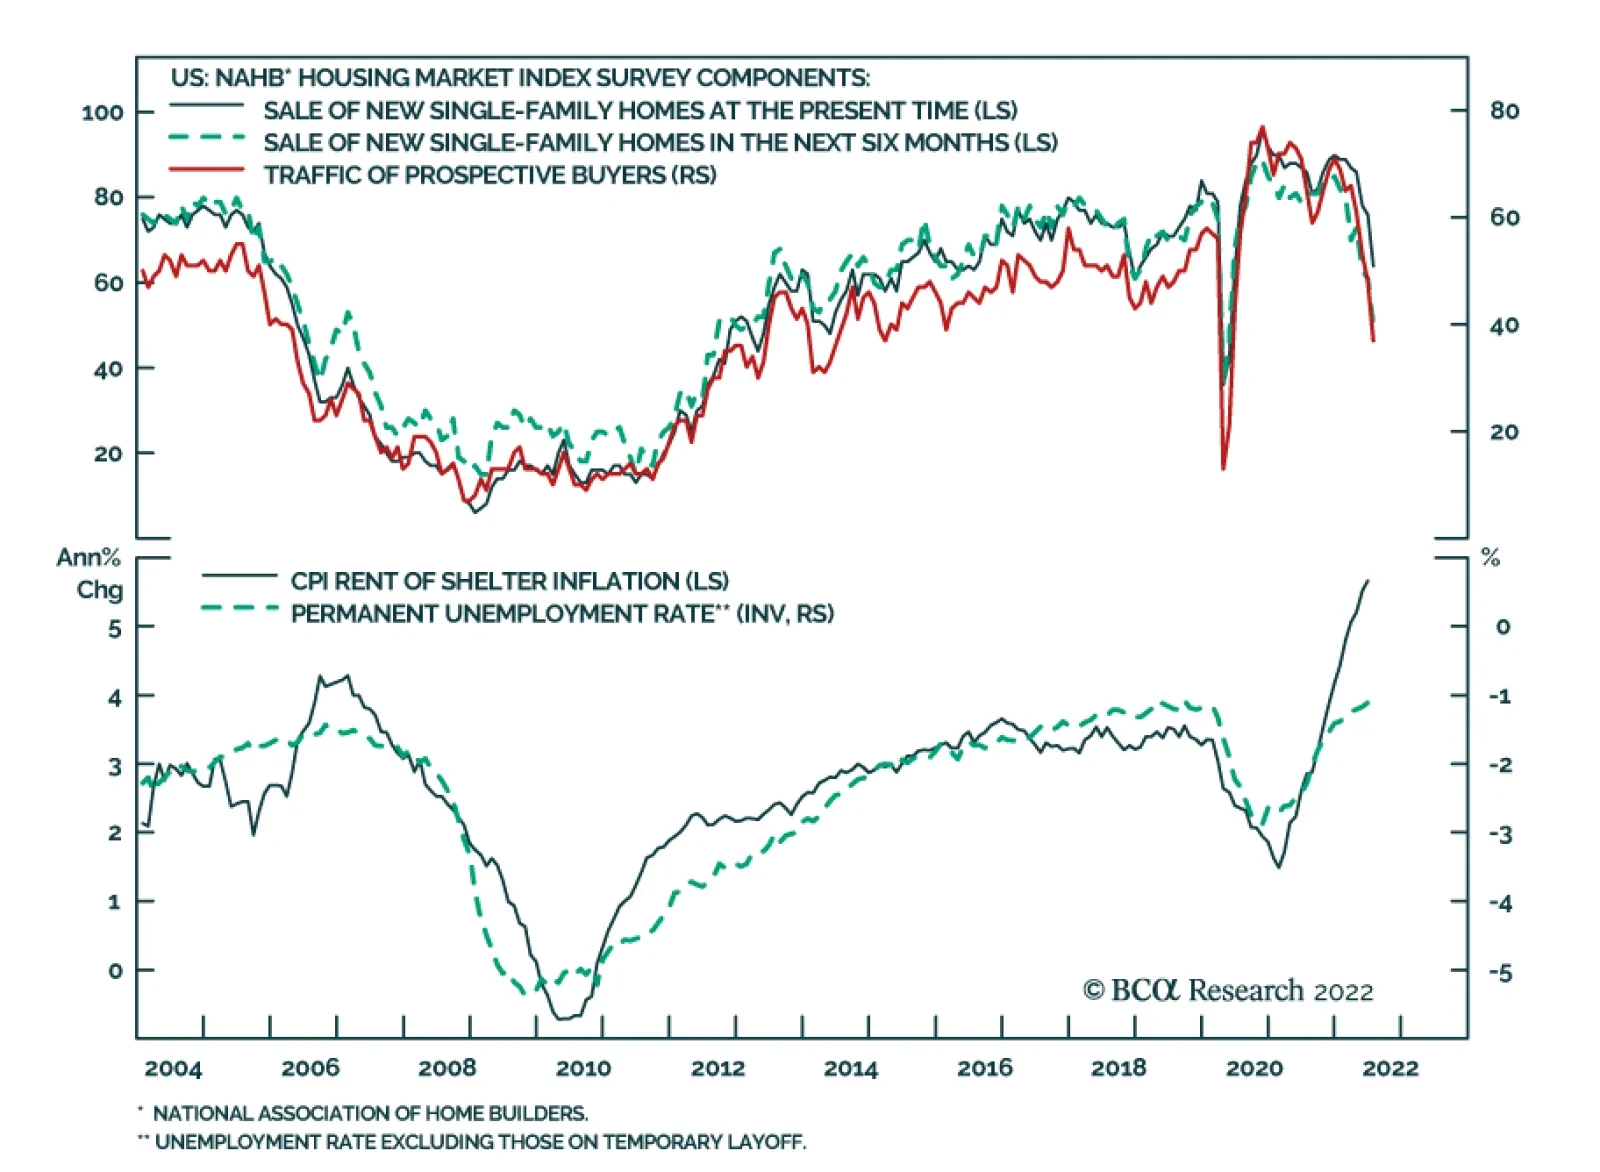
The NAHB Housing Market Index, which measures sentiment among US homebuilders, dropped by a greater-than-expected 12 points to 55 in July, the lowest level since May 2020 and the second largest single-month drop in the index's 37-year history. All three…

Executive Summary Compared to output, income and net worth, aggregate consumer indebtedness is at the low end of its twenty-first century range. Modest indebtedness and low interest rates have made it easy for households to service their debt and leave them with room to take on more. Low-income households are beginning to show some signs of strain and it appears most of them have used up their pandemic savings. Loans have been underwritten more rigorously since the crisis, however, and borrower quality has been rising, especially since the pandemic began. Loan performance always deteriorates during recessions, but attention-getting claims about credit busts appear to be overheated. Consumer borrowers are on solid footing, and the financial system is not particularly vulnerable to a consumer credit downturn. The White House is reportedly mulling some measure of student loan forgiveness for a targeted set of households at the lower end of the wealth and income distributions. The overall package will have to be small, but it may make a difference for some of the more vulnerable borrowers. Consumers Are Starting From A Good Place
Consumers Are Starting From A Good Place
Consumers Are Starting From A Good Place
Bottom Line: Reports of the American consumer’s demise have been greatly exaggerated. Consumer credit is way down on the list of things to worry about in the current environment, and investors should not be distracted by sensationalized claims about bursting bubbles. Feature Our internal research meeting last Monday, live-streamed and archived in the Live & Unfiltered section of BCA's website, addressed media reports of an increase in auto repossessions. The juiciest report featured the anecdotal observations of Lucky Lopez, YouTuber and owner of Automotive Life, a Las Vegas-based auto-related company with a somewhat ambiguous mission. Lopez’s LinkedIn profile indicates that he has a wide range of experience in the automotive industry as an owner/operator of auto repair shops, an auto body shop, a rental car company and a car dealership, though he is now a consultant and coach for all automotive businesses. Although a cursory Google search indicates that the customer experience at his past businesses has not been uniformly happy, his January YouTube video, “Used Car Market Bubble Popped !!!” has garnered over 300,000 views, raising his profile beyond the bounds of the Internet’s echo chambers. That article also referenced the work of a professor, now at New York’s Cardozo Law School, who has warned that pandemic aid merely delayed the onset of an auto-loan crisis. “The bubble is beginning to show signs of bursting soon,” she said in the column. According to Google Scholar, her 2021 paper, “Bursting the Auto Loan Bubble in the Wake of COVID-19,” has subsequently been cited by three other papers, two of which she co-authored. She and the other people featured in the column pointed to reports of surging repossessions as a cause for alarm, but repo data are hard to come by and delinquency patterns don’t suggest that default rates are headed meaningfully higher. The internal discussion motivated us to look more deeply into consumer creditworthiness. After considering the level and composition of household indebtedness, borrower quality and borrower performance, we conclude that consumer credit is in a good place. It will worsen when the recession arrives, but it will start from a better than usual position and therefore poses less of a threat to financial markets and economic output than it typically would. Our findings reinforce the idea that the economy is not beset by imbalances that increase its vulnerability to an especially nasty recession. Household Indebtedness In contrast to the murky world of auto repos, there are several lengthy data series that allow us to evaluate households’ aggregate financial position. As a share of GDP, household debt is back to the 75% level it first reached 20 years ago (Chart 1), driven by the deleveraging that followed the financial crisis (the pandemic spike was about sudden GDP contraction, not increased borrowing). Adjusted for disposable income, the after-tax cash flowing to consumers to service their obligations, the pattern is the same, as mortgage indebtedness has unwound its crisis excesses while other consumer debt has remained steady (Chart 2). The growth in household borrowing has failed to keep up with appreciating asset values and debt as a share of household net worth fell to multi-decade lows at the end of the first quarter (Chart 3). Chart 1Household Balance Sheets Have Been Strengthening For A Decade
Household Balance Sheets Have Been Strengthening For A Decade
Household Balance Sheets Have Been Strengthening For A Decade
Chart 2A 20-Year Round Trip
A 20-Year Round Trip
A 20-Year Round Trip
Chart 3Debt Is Markedly Lower As A Share Of Net Worth, ...
Debt Is Markedly Lower As A Share Of Net Worth, ...
Debt Is Markedly Lower As A Share Of Net Worth, ...
Chart 4... And Falling Rates Have Made It Especially Easy To Service
... And Falling Rates Have Made It Especially Easy To Service
... And Falling Rates Have Made It Especially Easy To Service
Low levels of indebtedness, combined with low interest rates, have eased households’ debt service burden, with the share of their disposable income that goes to interest and principal repayments falling to multi-decade lows (Chart 4). No matter how you slice it, the debt yoke is as light as it has been heading into the last four recessions. From a composition perspective, mortgages maintain the dominant position, accounting for nearly three-fourths of household debt (Chart 5), while student loans (11%), auto loans (8%) and credit cards (6%) comprise nearly all the rest. Although those warning of an auto bubble cite rising auto loan balances as a sign of trouble, they have been mostly steady as a share of disposable income since 2015 and remain well short of their 2002-to-2005 peak. Chart 5Consumer Credit Has Moved In Step With Disposable Income For The Last 20 Years
Consumer Credit Has Moved In Step With Disposable Income For The Last 20 Years
Consumer Credit Has Moved In Step With Disposable Income For The Last 20 Years
Bottom Line: Household indebtedness is much more manageable now than it was ahead of the last four recessions, thanks to reduced balances relative to income and wealth and lower interest rates. Borrower Quality As household balance sheets strengthen, consumer borrowers become better credits, but loan quality is also a function of lenders’ appetites. Bad loans are made in good times, according to the bank examiner’s mantra, but the corollary is also true. Reluctant lenders make sound loans and banks lost some of their appetite after the crisis while regulators took away much of what was left of it. Basel III standards clipped banks’ wings by applying onerous capital charges to all but the most straightforward lending activity and Fannie Mae’s and Freddie Mac’s aggressive stance on returning defaulted residential mortgages to their originators over an uncompromisingly strict reading of representation and warranty claims have forced banks to scrutinize prospective homeowners’ credentials. Increased scrutiny has shown up in the vastly improved risk profile of mortgage originations (Chart 6), which are now overwhelmingly tilted in favor of prime-plus (FICO score of 720 to 780) and superprime (greater than 780) borrowers and away from near prime (600 to 660) and subprime borrowers (less than 600). It is understandable that investors who lived through the trauma of the financial crisis just over a decade ago remain sensitive to housing market vulnerability, but we think the FICO score data forcefully rebut any lingering concerns about residential mortgages. Chart 6Residential Mortgage Originations By FICO Score
How Creditworthy Are American Consumers?
How Creditworthy Are American Consumers?
The remainder of household debt, detailed in the Fed’s monthly consumer credit reports, is primarily concentrated in student loans, auto loans and credit cards. Student loan balances, adjusted for disposable income, surged in the wake of the financial crisis to surpass declining credit card balances, which slid further in the early stages of the pandemic, and stable auto loans. Student loan borrowers at the lower end of the wealth and income distributions may soon have some of their obligations canceled, which may help consumer credit performance at the margin (Box), though the resumption of paused monthly payments will likely make the net effect a wash. The biggest banks’ customers are beginning to carry slightly higher credit card balances and though the banks have surely eased their standards to make more of their most profitable loans, we do not foresee cards as a systemic vulnerability. BOX Student Loan Debt: Pause, Play Or Erase Student loan borrowers have been able to pause making payments on their loans since the CARES Act took effect in April 2020, but the seventh extension of the temporary pause expires at the end of August and there will not be another. The Biden administration is grappling with whether to make good on a campaign promise to cancel at least some student debt held by the federal government. Washington holds over 80% of outstanding student loans and could wipe out any or all of it via executive order but the political calculus is complicated and perilous: the Democrats would like to appeal to young voters before the midterms, as well as women, who are on the hook for almost 60% of student debt, without alienating less well-off voters who might view cancellation as a giveaway to wealthy elites. Our US Political Strategy service expects that cancellation will be limited and targeted, too small to move the needle on aggregate household finances but perhaps providing the most vulnerable borrowers temporary relief to allow them to better service their other debt and/or maintain their consumption in the face of high food and fuel prices. That leaves auto loans as the swing factor within consumer credit performance. Despite the auto bubble-watchers’ assertions, anonymized Equifax data compiled by the New York Fed for its quarterly Household Debt and Credit Report do not indicate that auto lending standards have been eased: since 2017, the share of auto loan originations made to near-prime and subprime borrowers has steadily declined while the share of prime-plus and superprime originations has risen (Chart 7). Auto lenders did relax their standards in 2013 through 2016, once they got some distance from the crisis, but they reversed the trend in 2017 and tightened the screws even more when the pandemic arrived, as per the moves in a diffusion index calculated by subtracting the share of below-prime originations from the share of above-prime originations (Chart 8). Chart 7Auto Loan Originations By FICO Score
How Creditworthy Are American Consumers?
How Creditworthy Are American Consumers?
Chart 8Tighter Standards On Showroom Floors And Used-Car Lots
How Creditworthy Are American Consumers?
How Creditworthy Are American Consumers?
Chart 9Collateral Values Have Surged
Collateral Values Have Surged
Collateral Values Have Surged
The increase in the value of the collateral securing outstanding auto loans, which have an average term of nearly six years, should help contain lender losses in the event of default (while encouraging borrowers not to default). Per the Manheim Used Vehicle Value Index, used car prices have risen between 150% and 180% since the 2016-2019 vintages of outstanding auto loans were issued (Chart 9). Cars driven for the last five or six years have been depreciating with each mile driven, so they would not bring 150-180% of their initial value if their lenders repossessed and sold them, but the unforeseen price appreciation does mean their loan-to-value ratios (LTVs) must be tiny if borrowers have kept up with their payments. Loans issued after used-car prices exploded higher in late 2020 are vulnerable on an LTV basis and are likely to generate larger-than-normal losses given default once vehicle prices come back to earth, but lenders are well insulated from losses on their older outstanding loans. Bottom Line: Borrower quality is robust relative to history. Mortgage lending standards have tightened considerably since the financial crisis and auto borrower quality has been improving since 2017. The most vulnerable student loan borrowers are likely to get some relief in the form of debt forgiveness and soaring used car prices will help shield auto lenders from losses on the loans they issued before the pandemic. Borrower Performance Monthly delinquencies across consumer borrowing categories support the idea that households are on firmer financial footing than they were before COVID-19. TransUnion’s publicly available data show that 60-day mortgage delinquencies have cratered, spending the last fourteen months at around one-half of their February 2020 level (Chart 10, bottom panel). 90-day credit card delinquencies, after rising from unprecedented lows, have settled over the last six months at about two-thirds of their February 2020 level (Chart 10, second panel). 60-day auto loan delinquencies are back to their pre-pandemic level (Chart 10, top panel), but they are a far cry from what alarmist claims would suggest. As we noted in the previous section, better borrowers and used car appreciation should help insulate lenders from losses on loans that were issued before car prices soared. Chart 10Consumer Delinquencies Remain Well-Behaved
How Creditworthy Are American Consumers?
How Creditworthy Are American Consumers?
The Road Ahead As a SIFI bank CFO put it last week when discussing his company’s second quarter earnings, no cracks in consumer borrower performance have shown up yet. Credit performance frays when growth decelerates and deteriorates when the economy contracts. The coming recession will be no different but what’s different this time is the starting point for consumer credit. Consumers often stretch their credit to the limit by the time output peaks but they are in a comfortably sustainable spot today. This time around, lenders did not abandon their credit standards to maintain market share in an increasingly overheated environment. The borrowing performance rule of thumb is that consumers will pay their debts unless they lose their jobs, get divorced or suffer catastrophic illness. Much therefore depends on employment, and the job market still looks strong. Initial jobless claims are still close to record-low levels, surveys indicate that businesses still have ambitious hiring intentions and plenty of positions need to be filled if the leisure and hospitality industry is going to meet pent-up demand. We will continue to monitor every data series that might lead consumer spending and consumer credit performance. The SIFI banks’ second-quarter earnings releases and calls end today with Bank of America and we will present our July 2022 Big Bank Beige Book report next week. Bank management teams don’t have crystal balls, but they do gain a wealth of insight into consumers’ appetites and businesses’ investment plans, and they often share some of it during their earnings calls with sell-side analysts. The macro backdrop remains fluid and fraught, and consumer credit prospects look a lot like the overall economy – far from perfect, but better than the financial market selloff and persistent gloom would imply. We remain more constructive than the consensus on the twelve-month outlook for financial markets and the economy. Doug Peta, CFA Chief US Investment Strategist dougp@bcaresearch.com
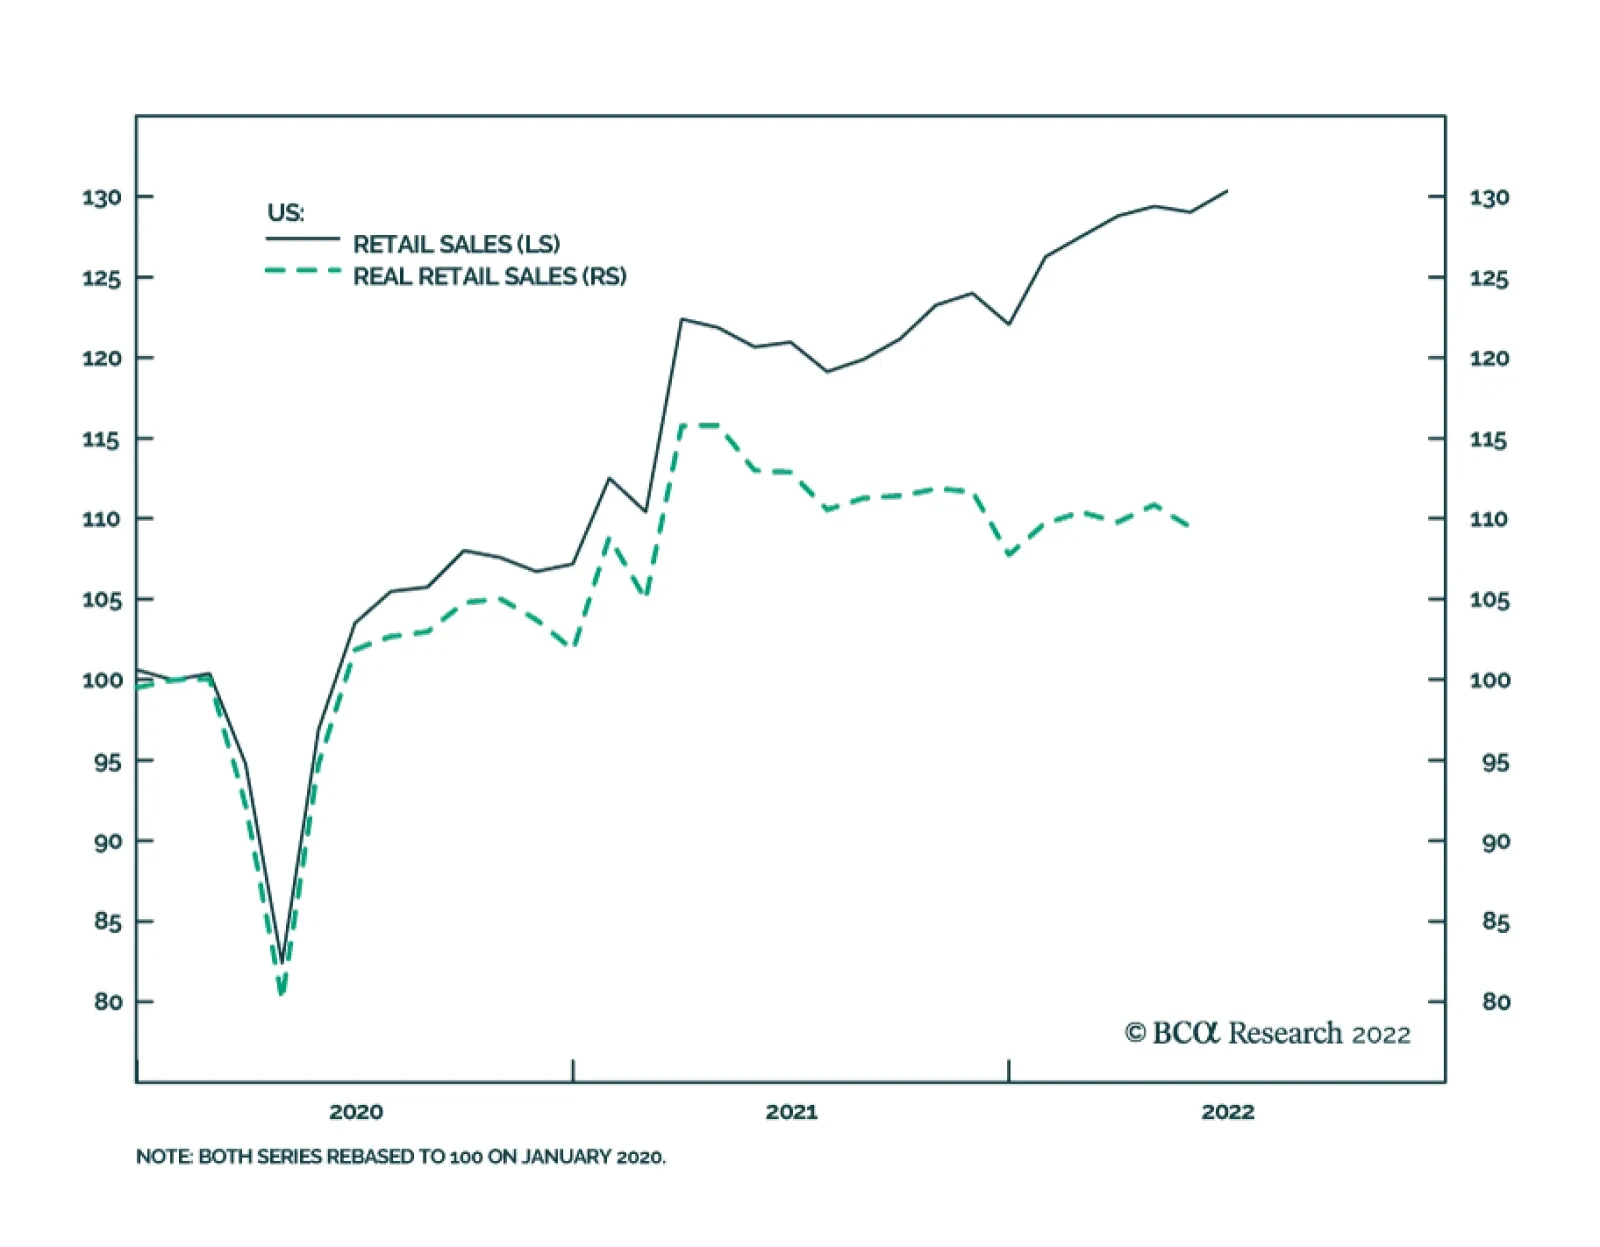
US nominal retail sales rose by a stronger-than-expected 1% m/m clip in June from an upwardly revised 0.1% contraction in May. Gasoline, online retail and home furnishing were the main contributors. A core measure excluding autos and gas – which have been…
Data released on Friday sends a positive signal about US consumption. In addition to the better-than-expected June retail sales report (see The Numbers), the preliminary release of the University of Michigan survey shows a surprise minor improvement in…
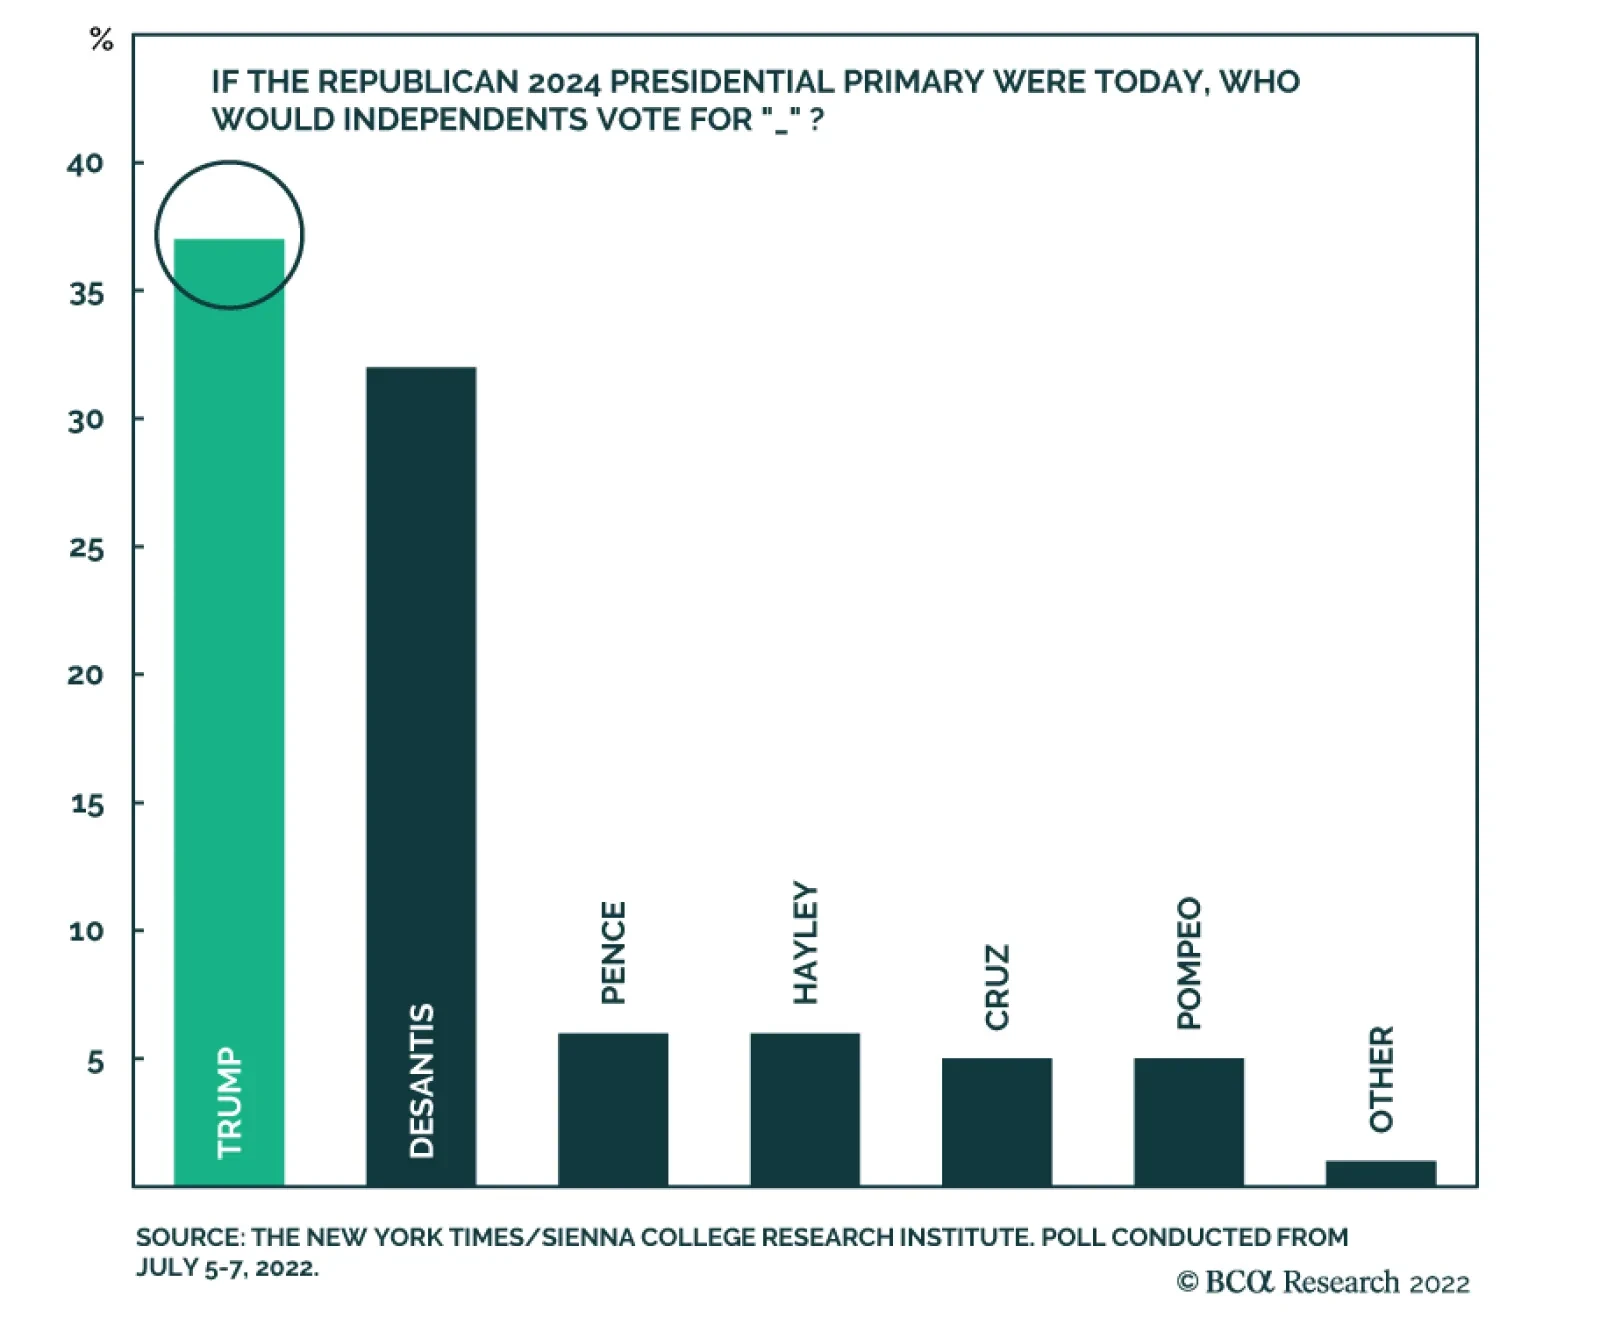
According to BCA Research’s US Political Strategy service, US economic policy uncertainty will rise ahead of the midterms, pull back afterwards, then rise again in advance of the 2024 election. While a lot can change in two years, the base case for 2024…
Listen to a short summary of this report. Executive Summary The TIPS Market Foresees A Sharp Deceleration In Inflation
What If The TIPS Are Right?
What If The TIPS Are Right?
TIPS breakevens are pointing to a rapid decline in US inflation over the next two years. If the TIPS are right, the Fed will not need to raise rates faster than what is already discounted over the next six months. Falling inflation will allow real wages to start rising again. This will bolster consumer confidence, making a recession less likely. The surprising increase in analyst EPS estimates this year partly reflects the contribution of increased energy profits and the fact that earnings are expressed in nominal terms while economic growth is usually expressed in real terms. Nevertheless, even a mild recession would probably knock down operating earnings by 15%-to-20%. While a recession in the US is not our base case, it is for Europe. A European recession is likely to be short-lived with the initial shock from lower Russian gas flows counterbalanced by income-support measures and ramped-up spending on energy infrastructure and defense. We are setting a limit order to buy EUR/USD at 0.981. Bottom Line: Stocks lack an immediate macro driver to move higher, but that driver should come in the form of lower inflation prints starting as early as next month. Investors should maintain a modest overweight to global equities. That said, barring any material developments, we would turn neutral on stocks if the S&P 500 were to rise above 4,050. US CPI Surprises to the Upside… Again Investors hoping for some relief on the inflation front were disappointed once again this week. The US headline CPI rose 1.32% month-over-month in June, above the consensus of 1.1%. Core inflation increased to 0.71%, surpassing consensus estimates of 0.5%. The key question is how much of June’s report is “water under the bridge” and how much is a harbinger of things to come. Since the CPI data for June was collected, oil prices have dropped to below $100/bbl. Nationwide gasoline prices have fallen for four straight weeks, with the futures market pointing to further declines in the months ahead. Agriculture and metals prices have swooned. Used car prices are heading south. Wage growth has slowed to about 4% from around 6.5% in the second half of last year. The rate of change in the Zillow rent index has rolled over, albeit from high levels (Chart 1). The Zumper National Rent index is sending a similar message as the Zillow data. All this suggests that inflation may be peaking. The TIPS market certainly agrees. It is discounting a rapid decline in US inflation over the next few years. This week’s inflation report did little to change that fact (Chart 2). Chart 1Some Signs That Inflation Has Peaked
Some Signs That Inflation Has Peaked
Some Signs That Inflation Has Peaked
Chart 2Investors Expect Inflation To Fall Rapidly Over The Next Few Years
What If The TIPS Are Right?
What If The TIPS Are Right?
TIPS Still Siding with Team Transitory If the TIPS market is right, this would have two important implications. First, the Fed would not need to raise rates more quickly over the next six months than the OIS curve is currently discounting (although it probably would not need to cut rates in 2023 either, given our higher-than-consensus view of where the US neutral rate lies) (Chart 3). The second implication is that real wages, which have declined over the past year, will start rising again as inflation heads lower. Falling real wages have sapped consumer confidence. As real wage growth turns positive, confidence will improve, helping to bolster consumer spending (Chart 4). To the extent that consumption accounts for nearly 70% of the US economy – and other components of GDP such as investment generally take their cues from consumer spending – this would significantly raise the odds of a soft landing. Chart 3The Fed Is Signaling That It Will Raise Rates To Almost 4% In 2023
The Fed Is Signaling That It Will Raise Rates To Almost 4% In 2023
The Fed Is Signaling That It Will Raise Rates To Almost 4% In 2023
Chart 4Positive Real Wage Growth Will Provide A Boost To Consumer Confidence
Positive Real Wage Growth Will Provide A Boost To Consumer Confidence
Positive Real Wage Growth Will Provide A Boost To Consumer Confidence
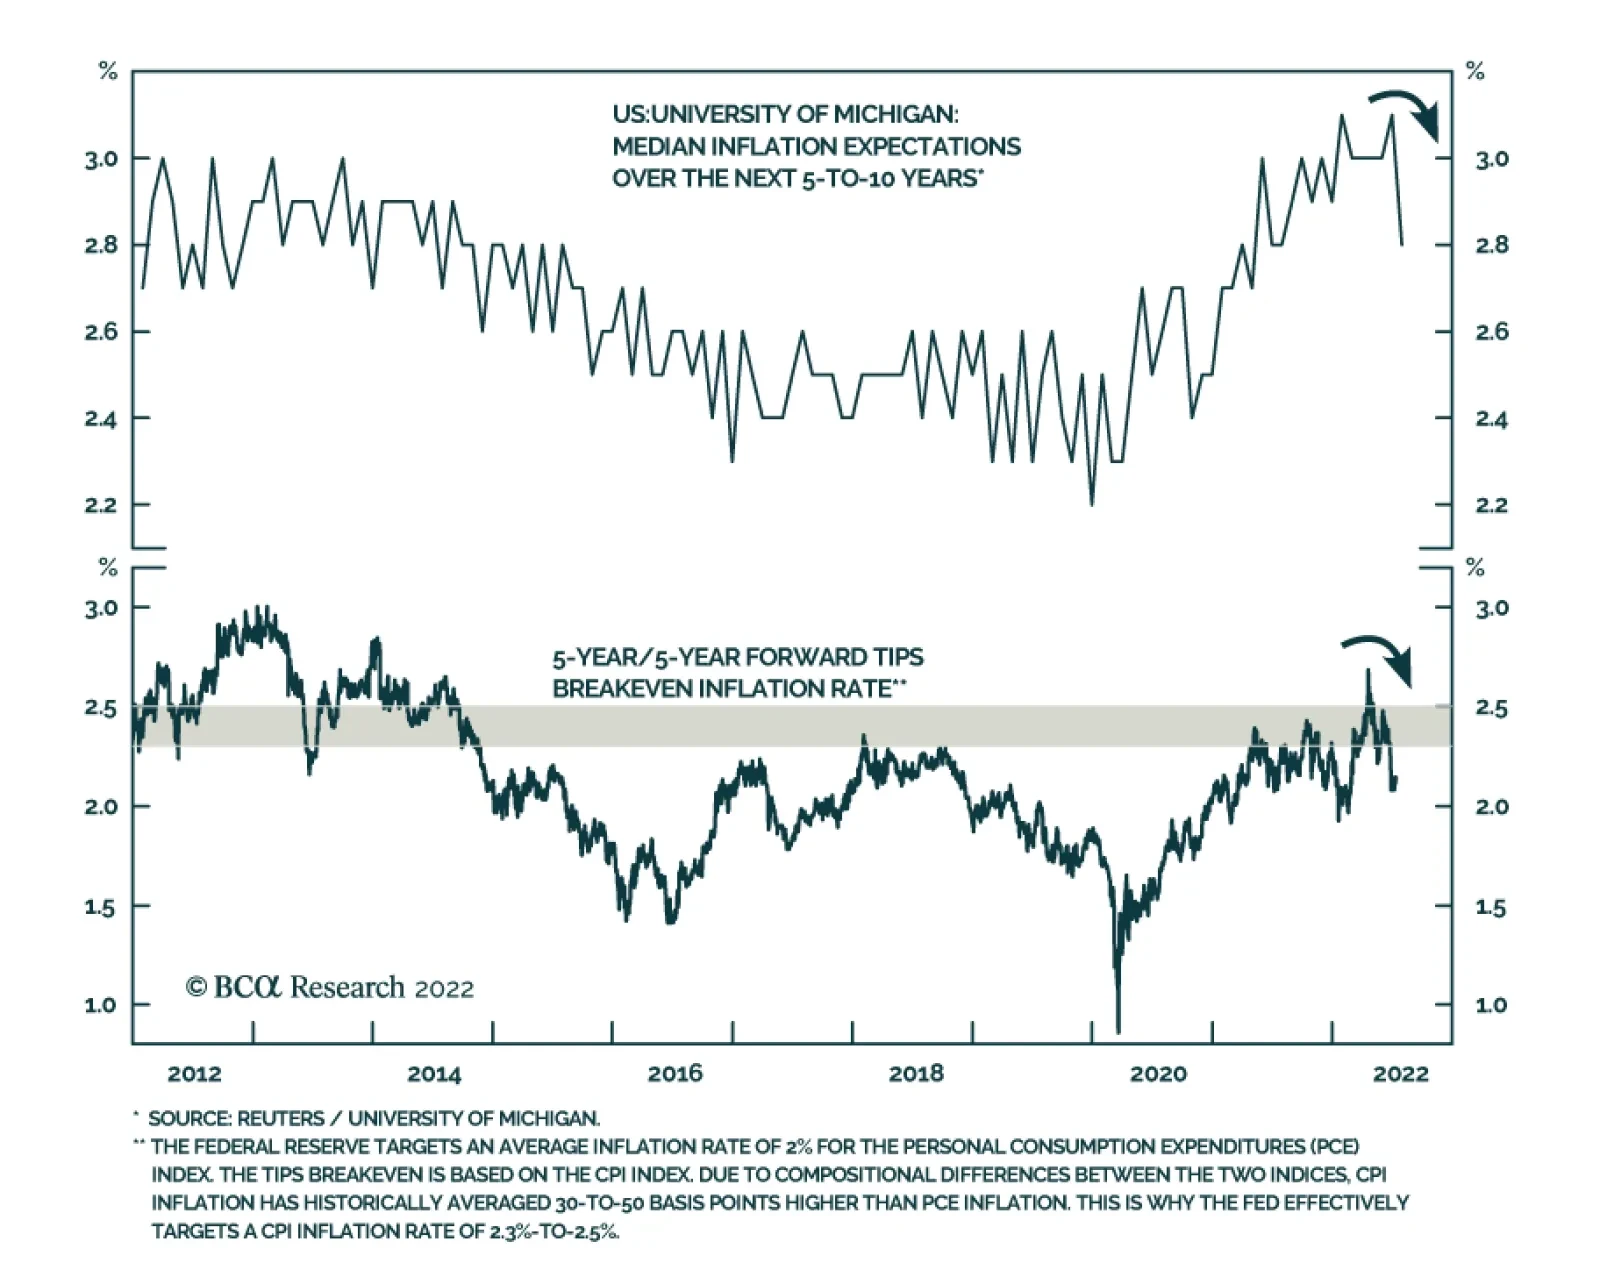
Chart 5Long-Term Inflation Expectations Remain Well Anchored
Long-Term Inflation Expectations Remain Well Anchored
Long-Term Inflation Expectations Remain Well Anchored
Of course, the TIPS market could be wrong. Bond traders do not set prices and wages. Businesses and workers, interacting with each other, ultimately determine the direction of inflation. Yet, the view of the TIPS market is broadly in sync with the view of most households and businesses. Expected inflation 5-to-10 years out in the University of Michigan survey has risen since the pandemic began, but at about 3%, it is close to where it was for most of the period between 1995 and 2015 (Chart 5). As we pointed out in our recently published Third Quarter Strategy Outlook, and as I discussed in last week’s webcast, the fact that long-term inflation expectations are well anchored implies that the sacrifice ratio – the amount of output that must be forgone to bring down inflation by a given amount — may be quite low. This also raises the odds of a soft landing. Investors Now See Recession as the Base Case Our relatively sanguine view of the US economy leaves us in the minority camp. According to recent polling, more than 70% of US adults expect the economy to be in recession by year-end. Within the investment community, nearly half of retail traders and three-quarters of high-level asset allocators expect a recession within the next 12 months (Chart 6). Chart 6Many Investors Now See Recession As Baked In The Cake
What If The TIPS Are Right?
What If The TIPS Are Right?
Reflecting the downbeat mood among investors, bears exceeded bulls by 20 points in the most recent weekly poll by the American Association of Individual Investors (Chart 7). A record low percentage of respondents in the New York Fed’s Survey of Consumer Expectations believes stocks will rise over the next year (Chart 8). Chart 7Bears Exceed The Bulls By A Wide Margin
Bears Exceed The Bulls By A Wide Margin
Bears Exceed The Bulls By A Wide Margin
Chart 8Households Are Pessimistic On Stocks
Households Are Pessimistic On Stocks
Households Are Pessimistic On Stocks
Resilient Earnings Estimates Admittedly, while sentiment on the economy and the stock market has soured, analyst earnings estimates have yet to decline significantly. In fact, in both the US and the euro area, EPS estimates for 2022 and 2023 are higher today than they were at the start of the year (Chart 9). What’s going on? Part of the explanation reflects the sectoral composition of earnings. In the US, earnings estimates for 2022 are up 2.4% so far this year. Outside of the energy sector, however, 2022 earnings estimates are down 2.2% year-to-date and down 2.9% from their peak in February (Chart 10). Chart 9US And European EPS Estimates Are Up Year-To-Date
US And European EPS Estimates Are Up Year-To-Date
US And European EPS Estimates Are Up Year-To-Date
Another explanation centers on the fact that earnings estimates are expressed in nominal terms while GDP growth is usually expressed in real terms. When inflation is elevated, the difference between real and nominal variables can be important. For example, while US real GDP contracted by 1.6% in Q1, nominal GDP rose by 6.6%. Gross Domestic Income (GDI), which conceptually should equal GDP but can differ due to measurement issues, rose by 1.8% in real terms and by a whopping 10.2% in nominal terms in Q1. Chart 10Soaring Energy Prices Have Boosted Earnings Estimates
Soaring Energy Prices Have Boosted Earnings Estimates
Soaring Energy Prices Have Boosted Earnings Estimates
How Much Bad News Has Been Discounted? Historically, stocks have peaked at approximately the same time as forward earnings estimates have reached their apex. This time around, stocks have swooned well in advance of any cut to earnings estimates (Chart 11). At the time of writing, the S&P 500 was down 25% in real terms from its peak on January 3. Chart 11Unlike In Past Cycles, Stocks Peaked Well Before Earnings
What If The TIPS Are Right?
What If The TIPS Are Right?
This suggests that investors have already discounted some earnings cuts, even if analysts have yet to pencil them in. Consistent with this observation, two-thirds of investors in a recent Bloomberg poll agreed that analysts were “behind the curve” in responding to the deteriorating macro backdrop (Chart 12). Chart 12Most Investors Expect Analyst Earnings Estimates To Come Down
What If The TIPS Are Right?
What If The TIPS Are Right?
Nevertheless, it is likely that stocks would fall further if the economy were to enter a recession. Even in mild recessions, operating profits have fallen by about 15%-to-20% (Chart 13). That is probably a more severe outcome than the market is currently discounting. Chart 13Even A Mild Recession Could Significantly Knock Down Earnings Estimates
Even A Mild Recession Could Significantly Knock Down Earnings Estimates
Even A Mild Recession Could Significantly Knock Down Earnings Estimates
Subjectively, we would expect the S&P 500 to drop to 3,500 over the next 12 months in a mild recession scenario where growth falls into negative territory for a few quarters (30% odds) and to 2,900 in a deep recession scenario where the unemployment rate rises by more than four percentage points from current levels (10% odds). On the flipside, we would expect the S&P 500 to rebound to 4,500 in a scenario where a recession is completely averted (60% odds). A probability-weighted average of these three scenarios produces an expected total return of 8.3% (Table 1). This is enough to warrant a modest overweight to stocks, but just barely. Barring any material developments, we would turn neutral on stocks if the S&P 500 were to rise above 4,050. Table 1A Scenario Analysis For The S&P 500
What If The TIPS Are Right?
What If The TIPS Are Right?
What’s the Right Framework for Thinking About a European Recession? Whereas we would assign 40% odds to a recession in the US over the next 12 months, we would put the odds of a recession in Europe at around 60%. With a recession in Europe looking increasingly probable, a key question is what the nature of this recession would be. The pandemic may provide a useful framework for answering that question. Just as the pandemic represented an external shock to the global economy, the disruption to energy supplies, stemming from Russia’s invasion of Ukraine, represents an external shock to the European economy. In the initial phase of the pandemic, economic activity in developed economies collapsed as millions of workers were forced to isolate at home. Over the following months, however, the proliferation of work-from-home practices, the easing of lockdown measures, and ample fiscal support permitted growth to recover. Eventually, vaccines became available, which allowed for a further shift to normal life. Just as it took about two years for vaccines to become widely deployed, it will take time for Europe to wean itself off its dependence on Russian natural gas. Earlier this year, the IEA reckoned that the EU could displace more than a third of Russian gas imports within a year. The more ambitious REPowerEU plan foresees two-thirds of Russian gas being displaced by the end of 2022. In the meantime, some Russian gas will be necessary. Canada’s decision over Ukrainian objections to return a repaired turbine to Germany for use in the Nord Stream 1 gas pipeline suggests that a full cutoff of Russian gas flows is unlikely. Chart 14The Euro Is 26% Undervalued Against The Dollar Based On PPP
The Euro Is 26% Undervalued Against The Dollar Based On PPP
The Euro Is 26% Undervalued Against The Dollar Based On PPP
During the pandemic, governments wasted little time in passing legislation to ease the burden on households and businesses. The European energy crunch will elicit a similar response. Back when I worked at the IMF, a common mantra in designing lending programs was that one should “finance temporary shocks but adjust to permanent ones.” The current situation Europe is a textbook example for the merits of providing income support to the private sector, financed by temporarily larger public deficits. The ECB’s soon-to-be-launched “anti-fragmentation” program will allow the central bank to buy the government debt of Italy and other at-risk sovereign borrowers without the need for a formal European Stability Mechanism (ESM) program, provided that the long-term debt profile of the borrowers remains sustainable. Get Ready to Buy the Euro All this suggests that Europe could see a fairly brisk rebound after the energy crunch abates. If the euro area recovers quickly, the euro – which is now about as undervalued against the dollar as anytime in its history (Chart 14) – will soar. With that in mind, we are setting a limit order to buy EUR/USD at 0.981. Peter Berezin Chief Global Strategist peterb@bcaresearch.com Follow me on LinkedIn & Twitter Global Investment Strategy View Matrix
What If The TIPS Are Right?
What If The TIPS Are Right?
Special Trade Recommendations Current MacroQuant Model Scores
What If The TIPS Are Right?
What If The TIPS Are Right?
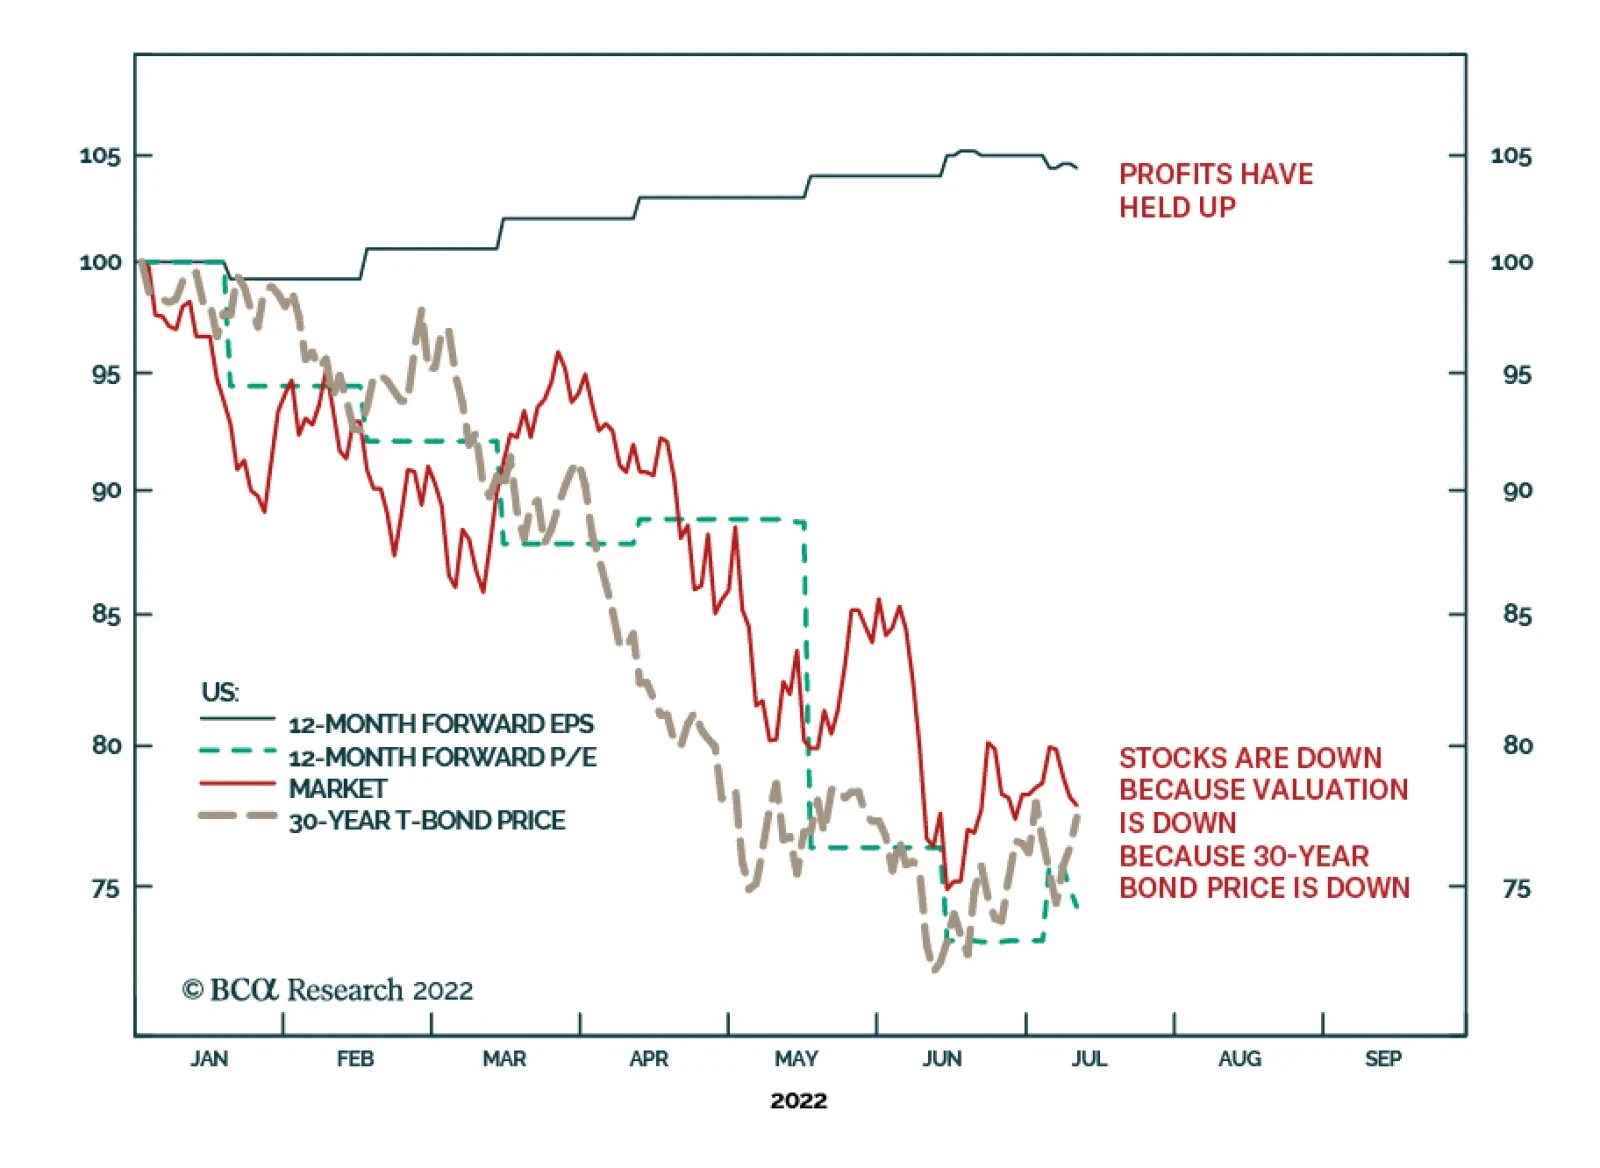
According to BCA Research’s Counterpoint Service, the stock market has not yet discounted a recession. Does the 2022 bear market mean that it has already discounted a recession? No, this year’s bear market is entirely due to a collapse in valuations.…
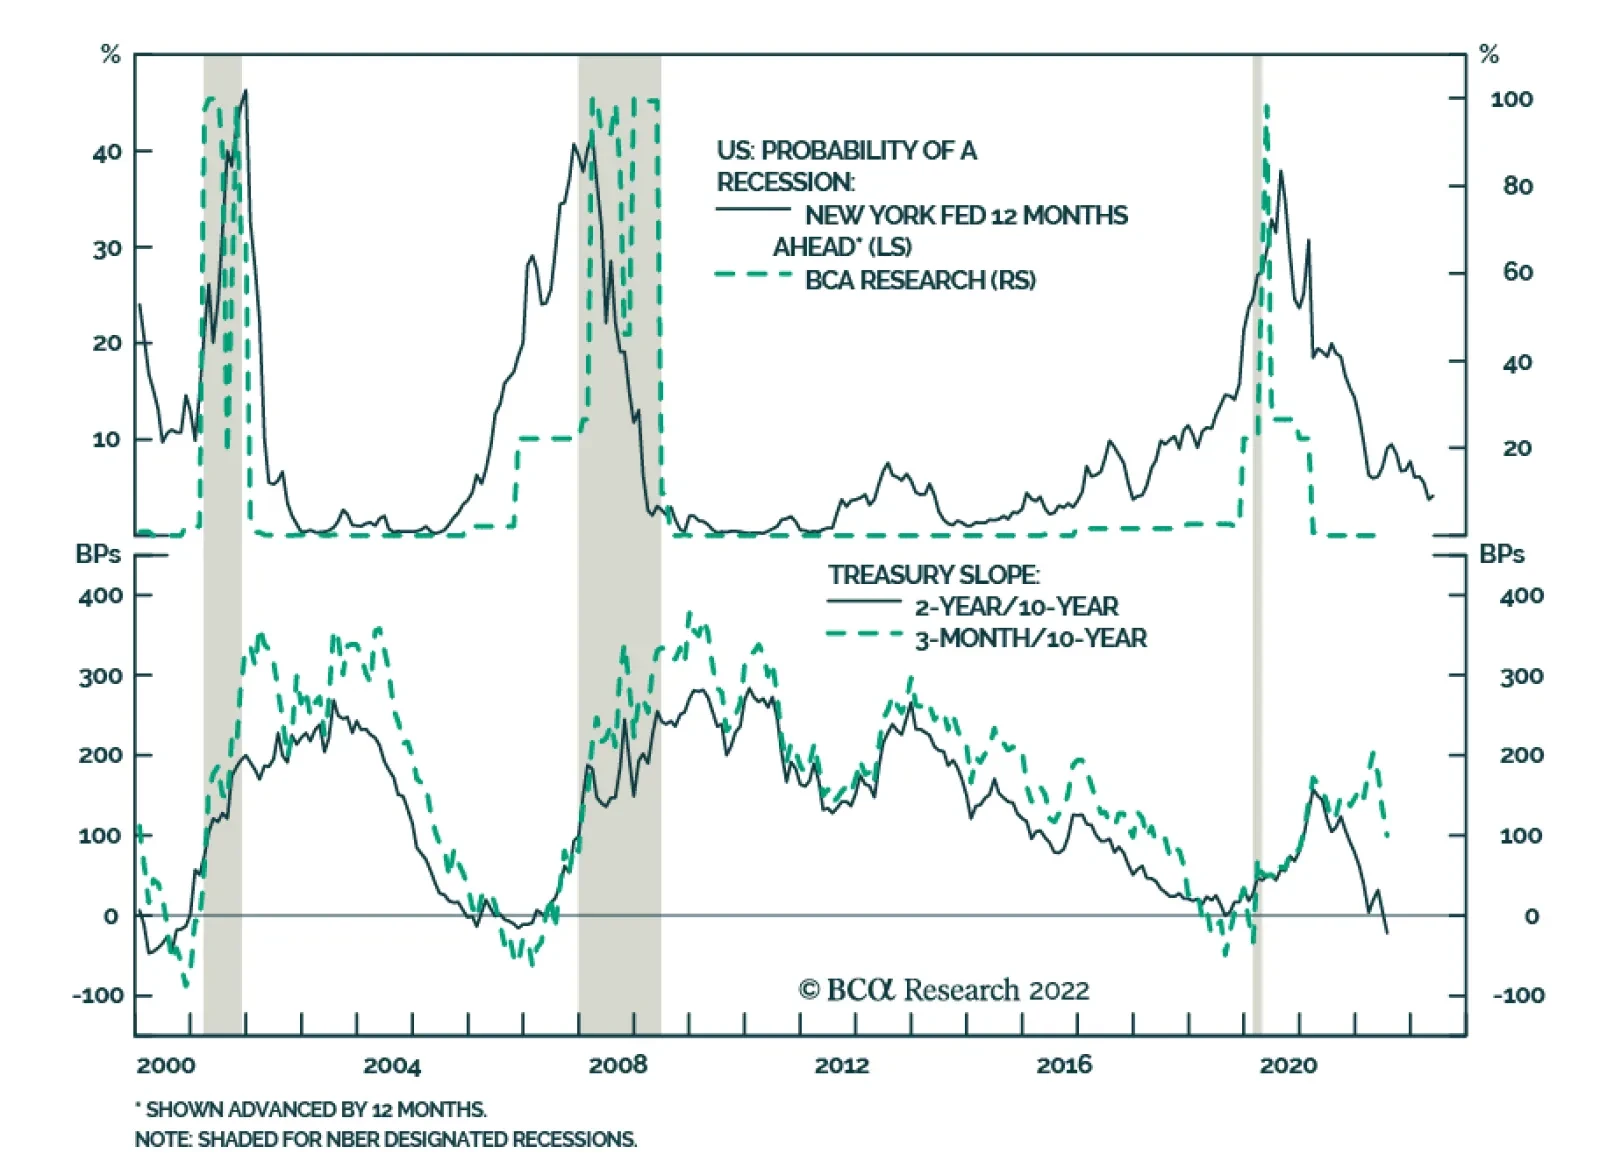
The Atlanta Fed’s GDPNow model is sending an extremely pessimistic signal about the US economy. However, formal recession models maintained by regional Feds do not suggest that a recession is imminent. The June reading of the New York Fed’s version – based on…
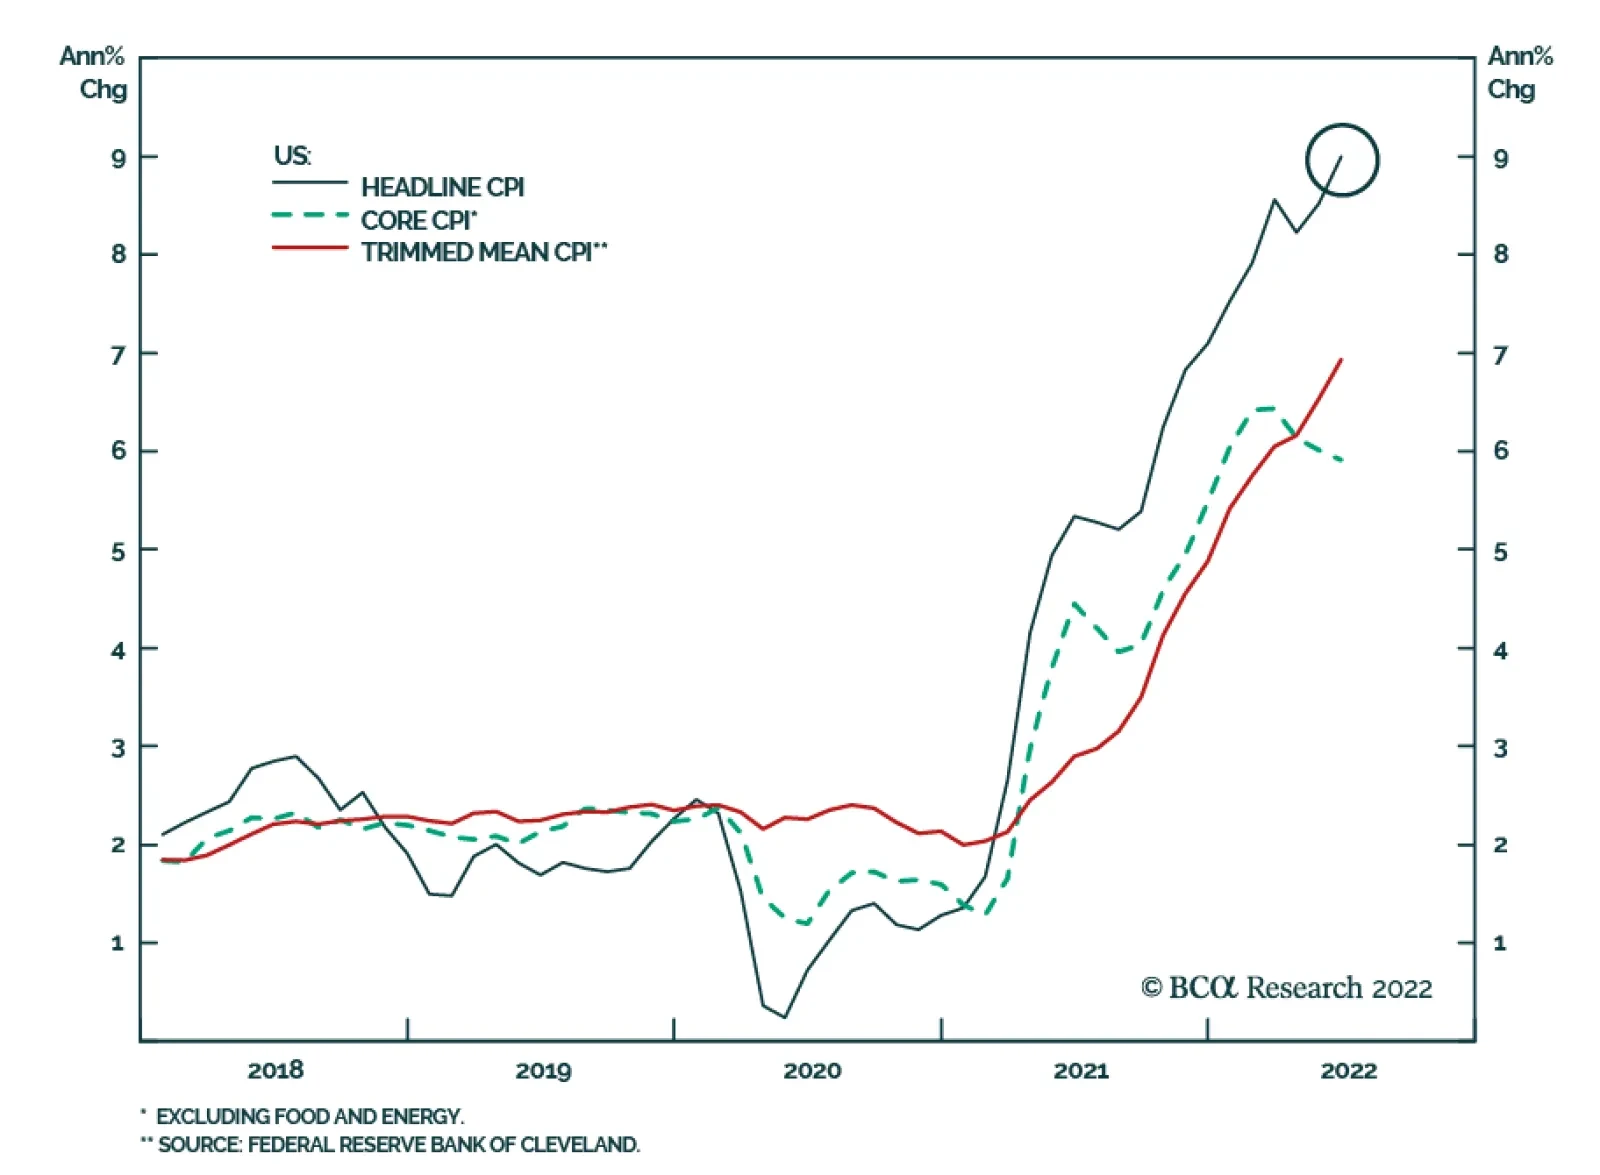
US headline CPI rose by a stronger-than-expected 9.1% y/y from 8.6% y/y (1.3% m/m from 1.0% m/m) in June, topping expectations of a milder increase. Gasoline, shelter and food continue to drive headline CPI. Notably, the core measure also firmed on a…