United States
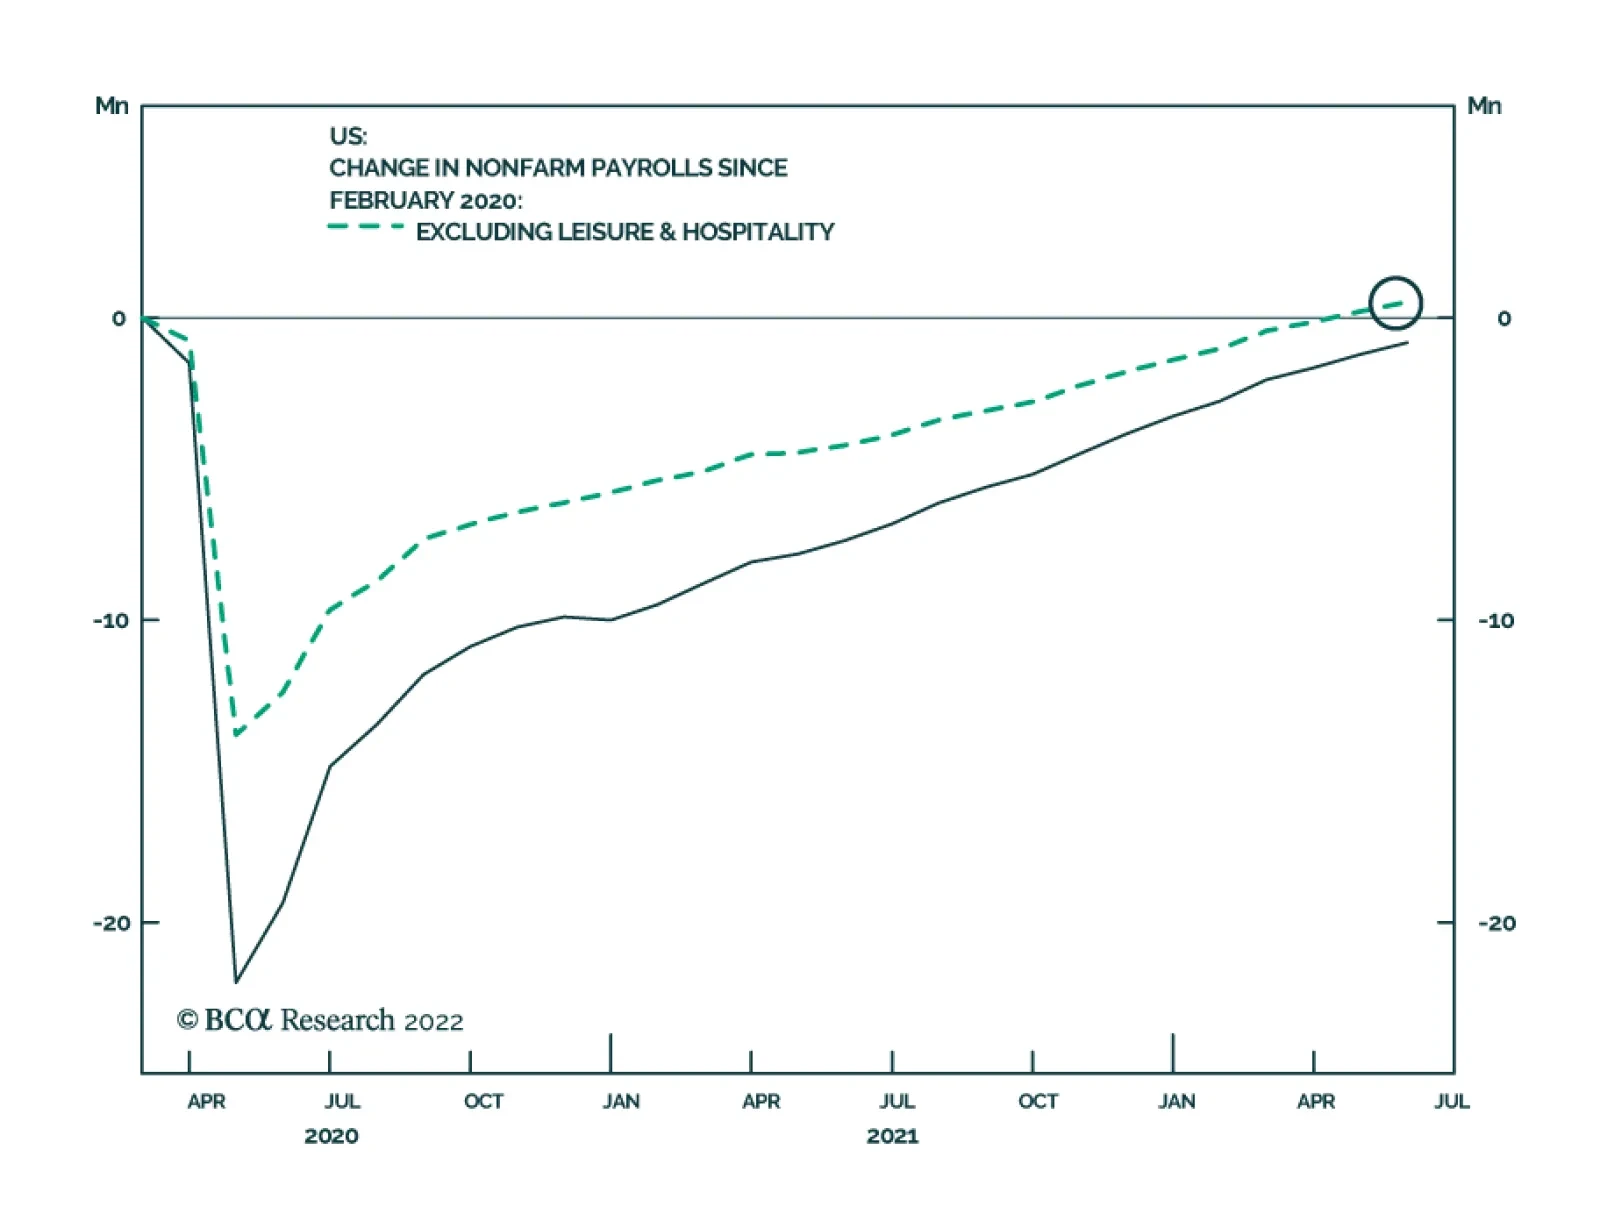
US nonfarm payrolls rose by 390 thousand in May, stronger than expectations of 318 thousand and down from an upwardly revised 436 thousand in April. The leisure and hospitality sector led the May payroll growth. Meanwhile manufacturing added 18 thousand jobs,…
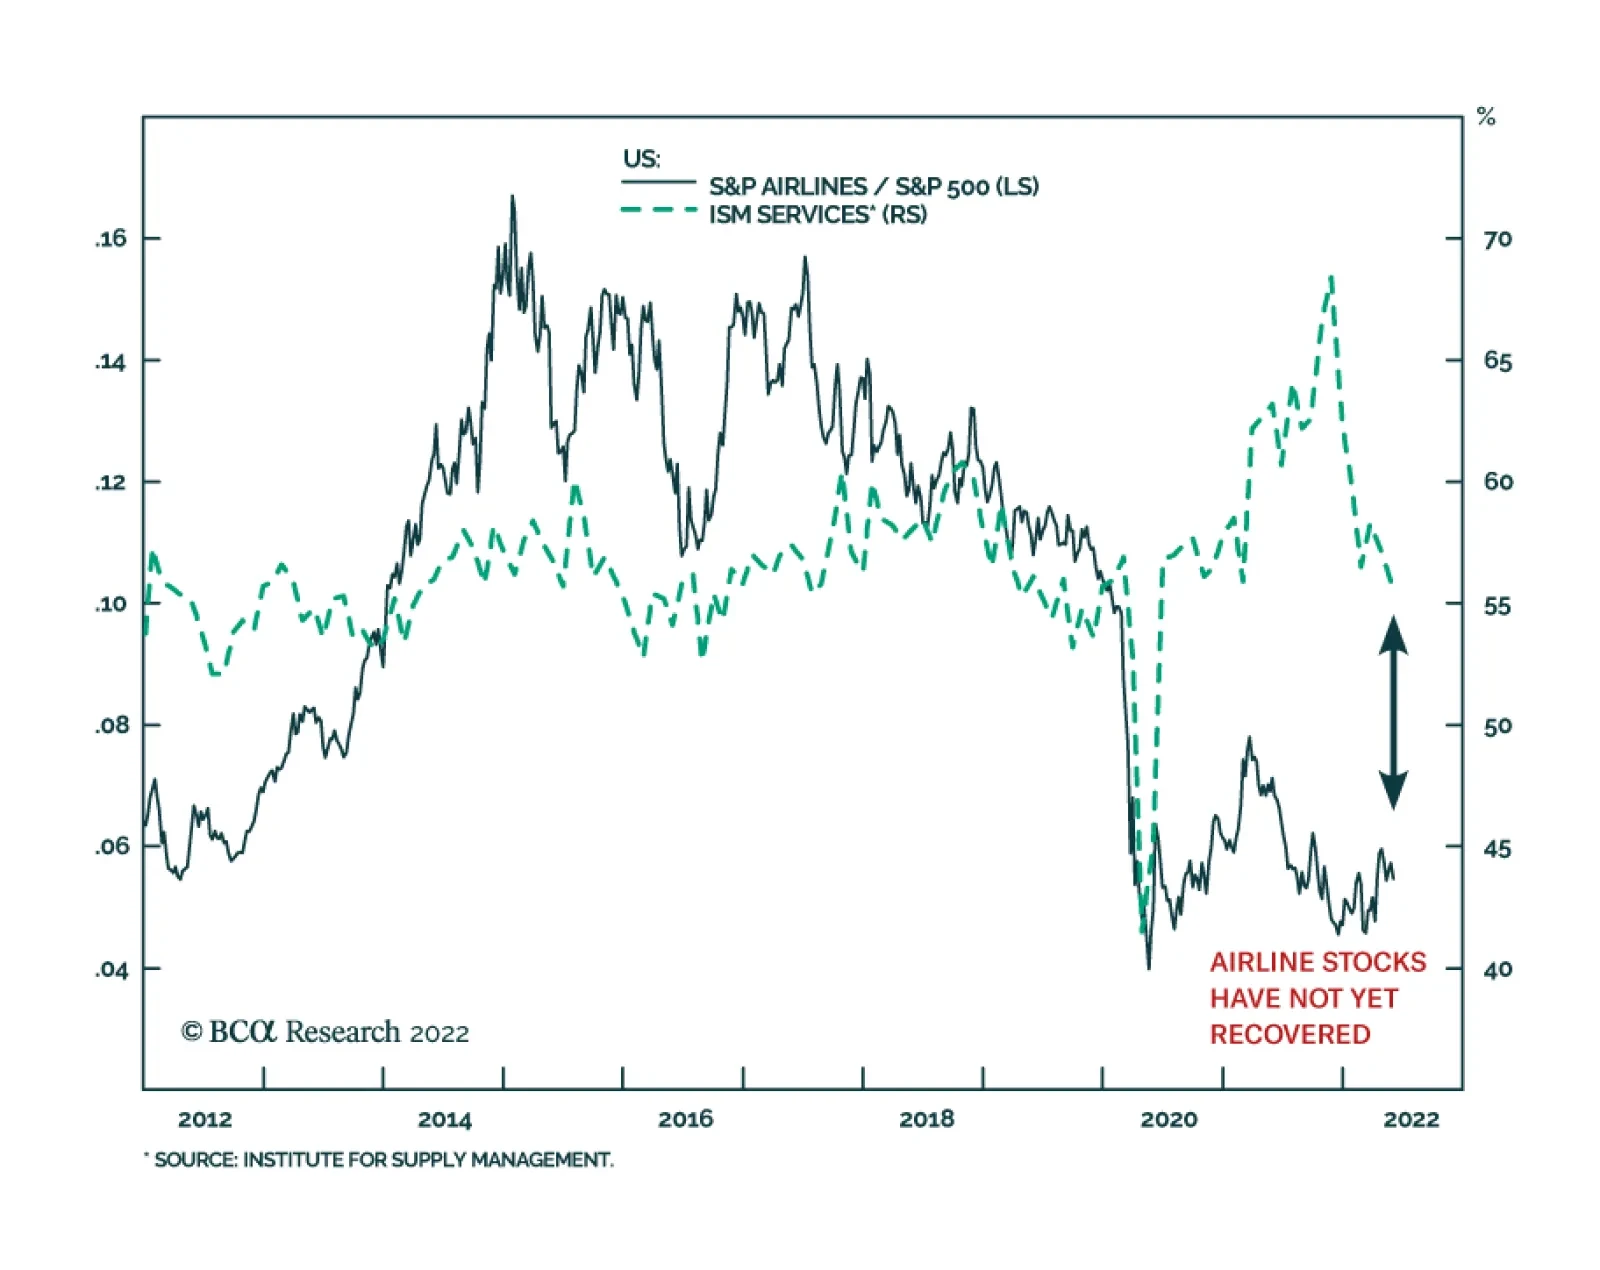
The headline ISM Services index eased by 1.2 points in May to 55.9. This latest reading signals the slowest expansion in service sector activity since February 2021 and reflects a 4.6-point decline in the Business Activity component. However, details from…
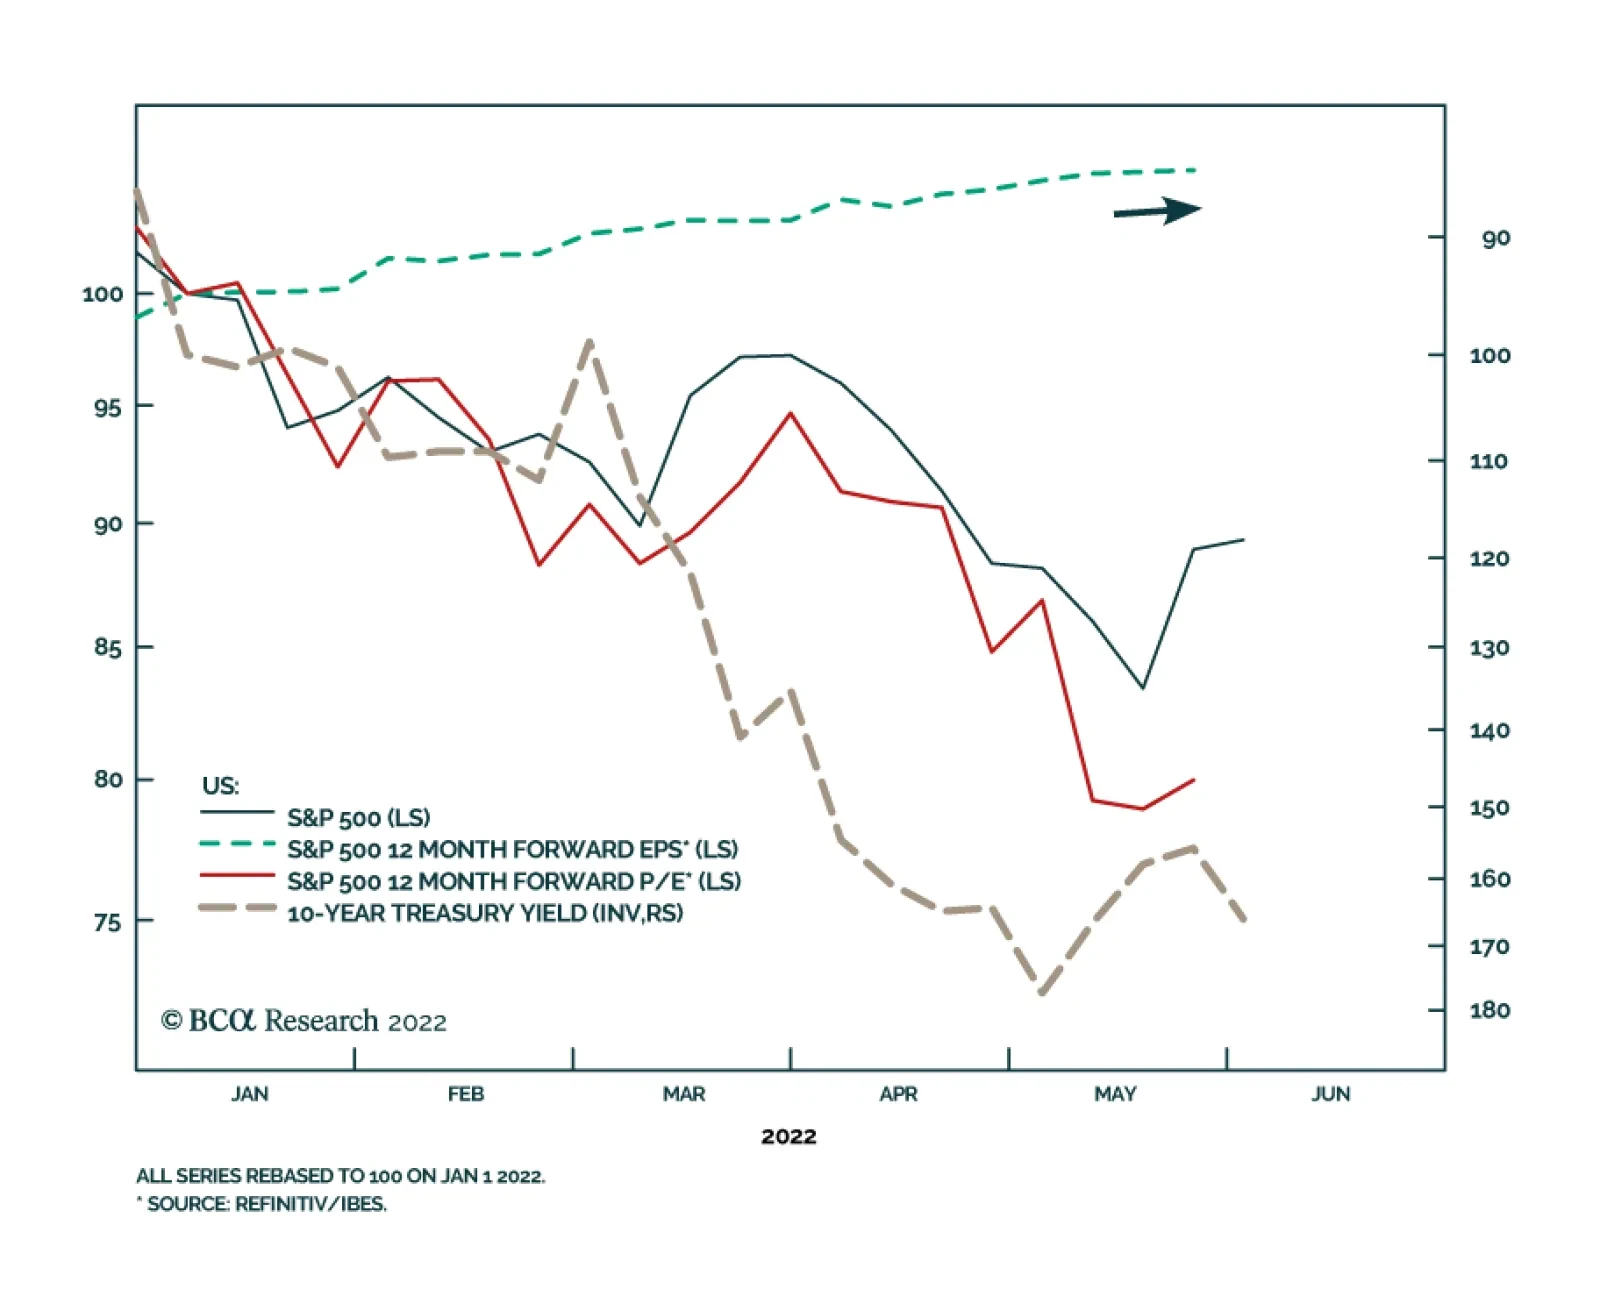
The S&P 500 has shed 13.8% since the beginning of the year on worries of a Fed-induced US recession, accelerating commodity prices and global growth slowdown. The selloff has been entirely valuation-driven. To the extent that Treasury yields provide…
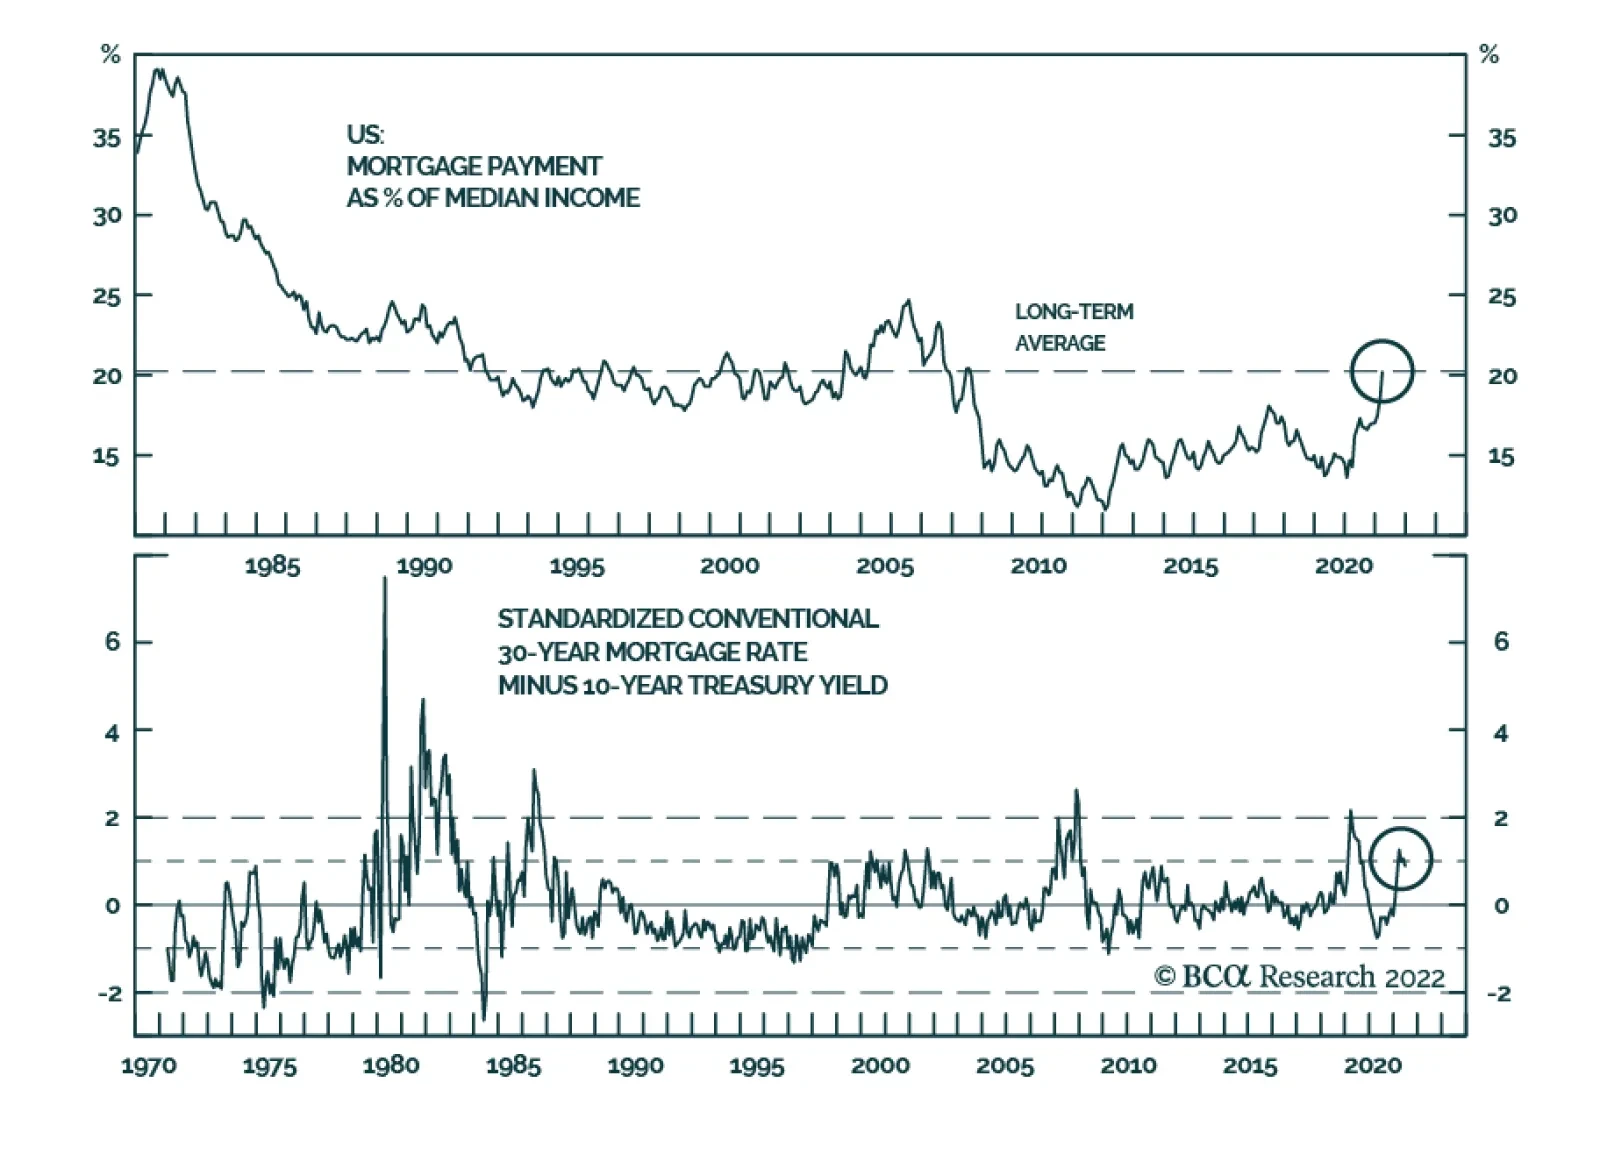
US housing, one of the most interest-rate sensitive sectors of the economy, has cooled in line with the two-percentage point rise in mortgage rates. Housing market dynamics affect aggregate growth via the wealth effect it exerts on consumption as well as…

Executive Summary Return Of The 'Pocketbook Voter'
Biden's Anti-Inflation Campaign
Biden's Anti-Inflation Campaign
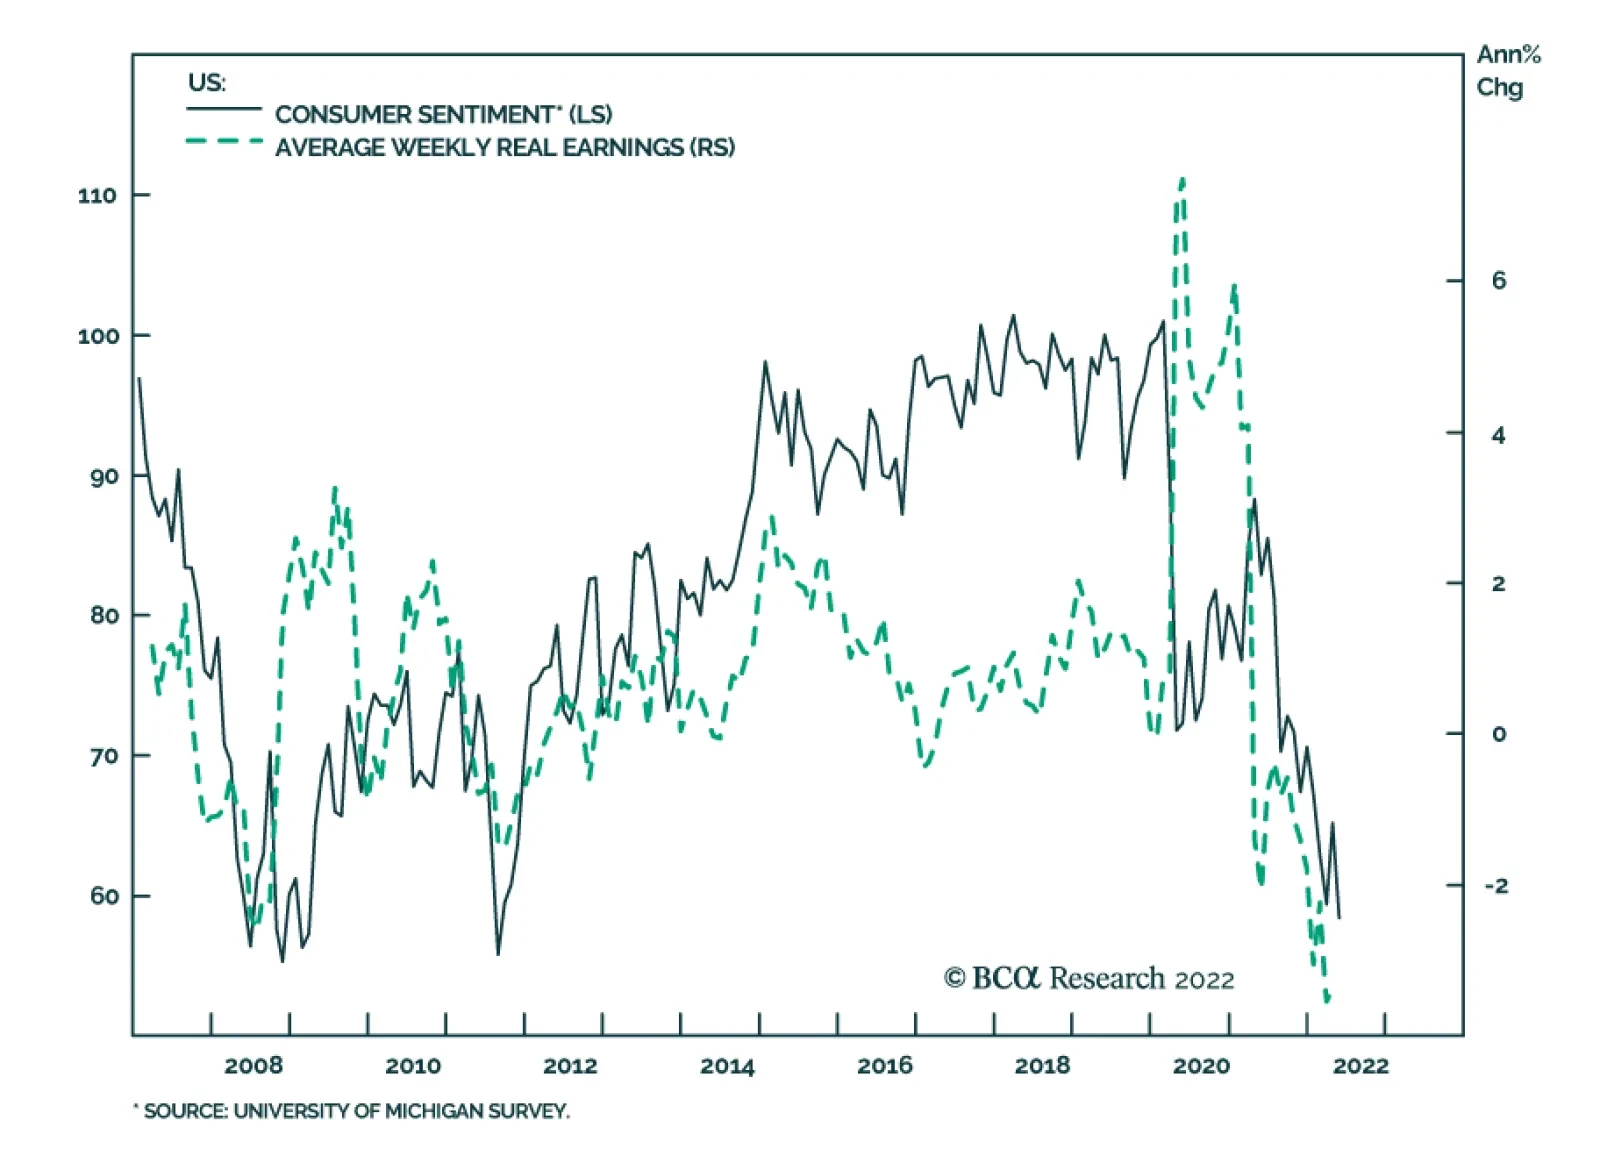
President Biden’s pledge to fight inflation ahead of the midterm elections got a boost with the Gulf Arab states pledging to increase oil production in July and August. Yet OPEC’s action should not be overrated. The Saudis are not clearly bailing out Biden … at least not yet. Biden’s other inflation-fighting tools are also limited. The Fed will hike rates, which will weigh on inflation, at least in the short run. A short-term moderation in inflation will cause big shifts in financial markets. It will not save the midterms for Democrats, but gridlock is disinflationary so the effect is the same. Inflation risks will persist over the long run. Recommendation (Cyclical) Inception Level Inception Date Return Small Vs. Large Cap Energy 0.6485 26-JAN-22 14.2% Oil And Gas Transportation And Storage Vs. S&P 500 0.0527 30-MAR-22 16.5% Bottom Line: Expect inflation to moderate in the short run. Oil prices will be volatile. Book a 14% profit on small cap versus large cap energy stocks and a 16.5% profit on the oil and gas transportation sub-sector relative to the broad market. Feature President Biden kicked off the summer – and the midterm election campaign – by defending his record thus far and pledging a three-pronged strategy to fight inflation. His options are limited but he received a boost from OPEC right off the bat. The bottom line is that disinflationary pressures are emerging. These include congressional gridlock, which is likely to return in January 2023. Biden’s policies will not save his party from a defeat in the midterms but moderating inflation will have huge investment consequences. Biden’s Three-Pronged Plan Consumer confidence is hurting while inflation eats away at real wage growth for Americans (Chart 1). Confidence is 14% higher than when Biden took office but 17.5% lower than when it peaked in June 2021. The latest survey from the Conference Board showed another decrease in May. This is foul weather for a ruling party that already stands to suffer a major check on its power when voters go to the polls in the fall. Biden’s approval rating is likely to stabilize but only at the current low level of 41.4%. Voters are focusing on the economy more than other issues like health care, the environment, or foreign affairs (Chart 2). Chart 1Consumer Confidence And Real Wages Tumble
Biden's Anti-Inflation Campaign
Biden's Anti-Inflation Campaign
Chart 2Return Of The 'Pocketbook Voter'
Biden's Anti-Inflation Campaign
Biden's Anti-Inflation Campaign
In the Wall Street Journal Biden laid out his party’s election pitch.1 First, he argued that the US economy is transitioning from rapid recovery to stable growth – i.e. that it is not going into recession. That would be good, but a recession is possible and the slowdown is politically deadly: Household Savings: Aggregate household savings have risen from $1Tn in 2019 to $3.9Tn today, which Biden cited as evidence of improving financial security. The problem is that inequality skews the picture and the average American is unlikely to feel secure. Low and middle income earners have depleted their savings or seen only a small increase (Chart 3). The Biden administration failed to improve inequality as promised while the uneven economic recovery means that lower-paid Americans do not have as much ability to buffer spending as the aggregate savings imply. They will be unhappy in November. Chart 3Normal Households No Longer Flush With Savings
Biden's Anti-Inflation Campaign
Biden's Anti-Inflation Campaign
Jobs And Wages: Biden highlighted the role of his economic stimulus in lowering unemployment and argued that Americans have better paying jobs. But inflation has eroded real wages and incomes, as highlighted in Chart 1 above. Business Investment: Biden argued that business investment is brisk. But sentiment is turning. New orders of core capital goods have rolled over and capex intentions are falling (Chart 4). Manufacturing Comeback: Biden also touted the US manufacturing comeback, claiming that factory jobs are growing at fastest rate in 30 years. But again the tide is shifting against him, with the employment component of manufacturing purchasing manager indexes now signaling contraction (Chart 5). Biden, like Presidents Trump and Obama, has invested heavily in the “Buy America” re-industrialization narrative, so this trend is threatening. Chart 4Business Investment Setback
Biden's Anti-Inflation Campaign
Biden's Anti-Inflation Campaign
Chart 5Manufacturing Employment Weakening
Biden's Anti-Inflation Campaign
Biden's Anti-Inflation Campaign
A recession may indeed be avoided but the risk will not go away in time for the election. A recent study showed that at today’s extremely high level of inflation and extremely low level of unemployment, the odds of recession range from 60%-70% over the next 12-24 months.2 Second, Biden promised voters that he will fight inflation with all the powers of the White House. He laid out a three-pronged approach. However, his options are fairly limited and voters will not change their minds easily over the next five months: The Fed will hike rates: Biden argued that it is the Fed’s job to fight inflation and he will not interfere with rate hikes. While Biden offered admirable verbal support for an independent and non-partisan central bank, the truth is that real interest rates have not been this low since the highly politicized Fed chairmanship of Arthur Burns (Chart 6). While Biden has no reason to discourage rate hikes at the moment, he may change his tune as rates rise, growth slows, and the presidential election approaches. So may Powell, but by then it may be too late. In short, the Fed will hike, which will weigh on inflation, but it will not help Biden win voters this fall or avoid a recession by 2024. Congress will expand capacity: Biden argued that the bipartisan infrastructure bill that he signed into law and his other legislative proposals will boost the supply side of the economy. We are moderately optimistic about Congress’s ability to pass a party-line reconciliation bill that provides subsidies for the energy sector. This could pass under the consensus-building rubric of fighting Russia and climate change at the same time. But this measure, along with Biden’s Housing Supply Action Plan, child care and elderly care subsidies, and other proposals often look more like demand-side stimulus than supply-side reforms. They would fan inflation by increasing government spending and budget deficits. Moreover the administration cannot fix broken supply chains while China remains subject to strict Covid-19 lockdowns (Chart 7). In short, Congress may pass a reconciliation bill but it would be mildly stimulating for the economy (i.e. inflationary) and none of the supply-side improvements would reduce inflation in time for the midterms. Chart 6Biden Doesn't Need To Interfere With The Fed
Biden's Anti-Inflation Campaign
Biden's Anti-Inflation Campaign
Chart 7Supply Snarls Will Continue While China Struggles With Covid
Biden's Anti-Inflation Campaign
Biden's Anti-Inflation Campaign
The budget deficit will fall: Biden argued that budget consolidation will reduce inflation, pointing to this year’s estimated $1.7 trillion drop in the budget deficit and arguing that the deficit is falling lower than pre-pandemic levels. He also argued that robust tax revenues from the economic recovery justified his previous fiscal stimulus (the American Rescue Plan Act). However, the budget is merely normalizing from extreme pandemic heights – there have obviously not been any long-term fiscal reforms (Chart 8). If Congress passes a reconciliation bill then Biden may succeed at passing a minimum corporate tax, which would mark an important success. But while the fiscal drag is negative for inflation, it is also negative for the economy this year and for Biden’s party in the midterms, and long-term budget trends are inflationary. Chart 8No Sign Of Budget Control Over Long Run – Budget Deficits Are Inflationary
Biden's Anti-Inflation Campaign
Biden's Anti-Inflation Campaign
The takeaway is that the Fed’s actions are disinflationary. Congress may or may not pass a climate bill before the election, but if it does, the budget deficit will be the same or larger and the economy will be the same or slightly stimulated. In brief Biden’s anti-inflation plan is to avoid interfering at the Fed. Extremely low unemployment will not save Biden and the Democrats this election season, any more than it saved Trump and the Republicans in 2018 (Chart 9). The Fed will rein in inflation at least in the short run. The election will lead to gridlock, which will freeze fiscal policy. Bottom Line: Inflation expectations will moderate but not because of any supply-side reform or fiscal consolidation coming from the Biden administration this year. Chart 9Low Unemployment Will Not Save Democrats
Biden's Anti-Inflation Campaign
Biden's Anti-Inflation Campaign
Will Biden Ease Russian Energy Tensions? No. Biden’s other avenues for reducing inflation – not addressed in his editorial – lie in the foreign policy realm. The Biden administration is turning toward foreign policy as gridlock settles over Capitol Hill. Biden’s foreign policy will be insular, reactive, and focused on the midterm elections. Could Biden facilitate ceasefire talks in Ukraine so as to ease energy pressures stemming from Russia? The short answer is no. Biden imposed an oil embargo on Russia and ultimately agreed to the EU’s embargo. Biden can afford to run large risks with Russia this year because a larger confrontation or crisis with Russia would not hurt the Democrats in the midterm elections. Indeed the best hope for the Democrats is to recreate the 1962 congressional election, when John F. Kennedy stared down Soviet leader Nikita Krushchev in the Cuban Missile Crisis in October just before the election. Kennedy’s Democrats lost four seats in the House, gained four in the Senate, and kept control of both. Biden’s approval rating is nowhere near Kennedy’s but his party’s outlook is bad enough that he may be willing to run the risk of a crisis that could lead to a favorable rally-around-the-flag effect in the fall (Chart 10). Biden’s clearance this week of the highly mobile artillery rocket system for Ukraine – despite the risk that Ukrainians would launch attacks into Russian territory – underscores this point. Bottom Line: Biden will not ease tensions with Russia ahead of the midterm to try to reduce energy prices. Chart 10Biden Can Risk A Bigger Russia Crisis
Biden's Anti-Inflation Campaign
Biden's Anti-Inflation Campaign
Will Biden Lower China Tariffs? No. What about China – will Biden ease the Trump administration’s tariffs on China to reduce inflation before the midterm election? Treasury Secretary Janet Yellen has repeatedly signaled support for this idea. The Trump administration marked a historic increase in US tariffs and the Biden administration has so far offered relief only for US allies (Chart 11). Again the short answer is no. Protectionist sentiment will prevail during midterm election season and US voters have turned decisively unfavorable toward China in recent years (Chart 12). The China tariffs have not been the driver for US inflation so tariff relief would bring minimal price relief while exacting a high political cost of making Biden look weak, wishy-washy on his pro-democracy values, and (according to Republicans) corrupt. Biden would be offering unilateral benefits to China without gaining Chinese trade concessions. Chart 11Biden Keeps Trump's Tariffs On China
Biden's Anti-Inflation Campaign
Biden's Anti-Inflation Campaign
Chart 12Protectionist Sentiment To Prevail Amid Midterms
Biden's Anti-Inflation Campaign
Biden's Anti-Inflation Campaign
Recently the Biden administration gave some indications of where it stands on China policy. Biden visited US allies in Asia Pacific and provoked China over the Taiwan Strait. Secretary of State Antony Blinken unveiled the administration’s comprehensive China policy and declared that the US would remain focused on China as the “most serious long-term challenge” despite Russia’s open belligerence in Europe.3 On paper, US-China trade relations do not look that bad. While China is falling short of its Phase One trade deal import promises, the truth is that a global recession intervened – and those promises were made under duress when the US slapped sweeping sanctions on Chinese exports. The commodity trade is booming, as is to be expected amid global energy shortages (Chart 13). The problem is that neither the US nor China has the domestic political capital to offer structural concessions in the short run, while both sides are girding for a century-long power struggle over the long run. Supply insecurity will result in the commodity trade suffering as a vast global substitution effect takes place. This is due to Russia’s energy breakup with Europe, growing Russia-China trade linkages, and ongoing US-China tensions. Global trade and US-China trade are set to slow, while China’s surge in energy imports from the US will abate for reasons of state security. Chart 13US-China Trade Faces Strategic Limits
Biden's Anti-Inflation Campaign
Biden's Anti-Inflation Campaign
Bottom Line: No reduction in US tariffs on China is likely. Any reduction will have minimal macroeconomic effects and will be replaced by other punitive measures, given the underlying strategic competition and protectionist election politics. Meanwhile China’s “Zero Covid” policy will weigh on trade ties and sustain price pressures in the short run, as mentioned. Will Biden Lift Iran Sanctions? Probably Not. What about the Middle East? Can Biden convince the core OPEC states to pump more oil in lieu of Russian production? Or can Biden lift sanctions on Iran to undercut soaring gasoline prices? On this front Biden received welcome news on June 2 when Gulf Arab states promised to increase production by 638,000 barrels per day in July and August, up from an expected 430,000. At the same time news broke that Biden will visit Saudi Arabia, including potentially Crown Prince Mohammed bin Salman (MBS), and other Gulf partners sometime in June. There is not yet a clear understanding between Biden and MBS but it is possible that one will develop. The trigger for OPEC’s declaration is the EU oil embargo on Russia. EU is finalizing an embargo on 90% of oil imports – everything except the oil flowing through the Southern Druzhba pipeline to land-locked eastern European states. The embargo will impair Russian energy production: it could fall by as much as 2-3 million barrels per day, distribution interruptions will occur as Russia transitions to Asian buyers, and Russia’s long-term production capacity could be damaged. The result could be a destabilizing price spike. While the core OPEC states have just enough spare capacity to cover that gap in theory (Chart 14), they will not want to commit all spare capacity at once. Chart 14OPEC Spare Capacity
Biden's Anti-Inflation Campaign
Biden's Anti-Inflation Campaign
There is still a lot of uncertainty about how rapidly the embargo will be enforced, how much Russian production will suffer, whether the OPEC states will meet these new production increases (all except Saudi have been falling short), and what will be the OPEC policy beyond August. But for now it is clear that the Gulf Arab states are helping the US and EU by signaling some extra supplies at a critical time. The Gulf Arabs benefit from high oil prices and have previously ignored the G7’s pleas to increase production. But they also need to prolong the business cycle – a cycle-killing price shock from Russia is not in their interest. They are interested in keeping up revenues, maintaining domestic stability, and maintaining their position as the gatekeepers of the global oil supply and price. Secondarily, they are interested in maintaining close relations with the US, which guarantees their national security. OPEC supply easing at this juncture is obviously beneficial to Biden ahead of the US midterm election in November. But there is not yet an understanding on this front because the US is also negotiating to rejoin the 2015 nuclear agreement with Iran, which Saudi Arabia and the Gulf states oppose. Biden’s trip to the Gulf suggests that nothing is settled yet. The OPEC production increase is not proof alone that the US is breaking off talks with Iran. If the Gulf states thought the US were going to strike a deal with Iran, they might produce more oil to preempt the deal and grab more market share, which is what they did in 2014 in advance of the original 2015 US-Iran nuclear deal. The Saudis do not want US shale producers and Iranian exporters to form an unholy alliance that steals market share and compromises Saudi security. Still, we expect the US-Iran deal to fall apart. The Biden administration does not have a unified international coalition to enforce sanctions on Iran. Nor does it have the political capital or longevity to give Iran credible security guarantees that would convince it to freeze its nuclear program. Recent events support our view. The UN atomic watchdog says that Iran’s stockpile of highly enriched uranium has risen by 30% in three months. Meanwhile the US seized an Iranian tanker off Greece, Iran seized two Greek tankers, and Greece warned about dangers to shipping in the Persian Gulf. To develop a better understanding between Biden and MBS, the US needs to assure the Saudis that it will not renew the deal with Iran. The Saudis will not provide oil at Biden’s whim but they may provide if they have satisfaction that the US will scrap the deal, or otherwise compensate them, such as through increased defense assistance (which Biden threatened to cut off when he entered office). Investors should expect OPEC to fall short of its current promises – and yet to try to provide the minimum production increases necessary to prevent a destabilizing oil spike. OPEC’s interest is to make a windfall for as long as possible, which means not killing the cycle out of greed. This policy could be positive for oil prices after the immediate downward price adjustment. But for now investors should merely expect oil volatility as the EU’s embargo enforcement, Russian retaliation, Russian oil production, OPEC implementation, and US sanctions on Iran are all up in the air. A successful US-Iran deal would deepen the drop in oil prices. But odds are 60/40 that that deal will fail, leading to an escalation of tensions in the Middle East. Biden will have to underscore the US’s red line against Iranian nuclear weaponization. Oil supply disruptions will increase in frequency across the region. Bottom Line: OPEC has given Biden’s anti-inflation campaign a boost but it is too soon to declare that oil prices will substantially abate. The US-Iran deal will likely fail, increasing Middle Eastern instability and supply risks. Investment Takeaways Given that we expect continued volatility in the oil space, we are booking a 14% gain on our long small cap energy versus large cap energy trade. We are also booking a 16.5% gain on our overweight position in the oil and gas transportation and storage sub-sector. We will revisit these trades in future reports. Overall we maintain a defensive portfolio strategy. Biden’s anti-inflation campaign is meeting with some success in the Middle East but the US confrontation with Russia and the likely failure of US-Iran talks suggests that price spikes can still kill more demand and lead to further growth upsets. Matt Gertken Senior Vice President Chief US Political Strategist mattg@bcaresearch.com Footnotes 1 See Joseph R. Biden, Jr, “Joe Biden: My Plan for Fighting Inflation,” Wall Street Journal, May 30, 2022, wsj.com. 2 See Lawrence H. Summers and Alex Domash, “History Suggests a High Chance of Recession over the Next 24 Months,” Harvard Kennedy School, March 15, 2022, www.hks.harvard.edu. 3 See Antony J. Blinken, “The Administration’s Approach to the People’s Republic of China,” US Department of State, May 26, 2022, state.gov. Strategic View Open Tactical Positions (0-6 Months) Open Cyclical Recommendations (6-18 Months) Table A2Political Risk Matrix
Biden's Anti-Inflation Campaign
Biden's Anti-Inflation Campaign
Table A3US Political Capital Index
Biden's Anti-Inflation Campaign
Biden's Anti-Inflation Campaign
Chart A1Presidential Election Model
Biden's Anti-Inflation Campaign
Biden's Anti-Inflation Campaign
Chart A2Senate Election Model
Biden's Anti-Inflation Campaign
Biden's Anti-Inflation Campaign
Table A4House Election Model
Biden's Anti-Inflation Campaign
Biden's Anti-Inflation Campaign
Table A5APolitical Capital: White House And Congress
Biden's Anti-Inflation Campaign
Biden's Anti-Inflation Campaign
Table A5BPolitical Capital: Household And Business Sentiment
Biden's Anti-Inflation Campaign
Biden's Anti-Inflation Campaign
Table A5CPolitical Capital: The Economy And Markets
Biden's Anti-Inflation Campaign
Biden's Anti-Inflation Campaign
Executive Summary Investors face a dilemma. The faster that inflation comes down, the better it will be for valuations via a stronger rally in the bond price. But if a collapse in inflation requires a sharp deceleration in growth, the worse it will be for profits. Bond yields are likely in a peaking process, but the sharpest declines may come a few months down the road, after an unambiguous roll-over in food and energy inflation. The stock market’s valuation-driven sell-off is likely over, but the danger is that it morphs into a profits-driven sell-off. As such, the stock market will remain under pressure through 2022, though it is likely to be higher 12 months from now in June 2023. High conviction recommendation: Overweight healthcare versus basic resources. In other words, tilt towards sectors that benefit the most from rising bond prices and that suffer the least from contracting profits. New high conviction recommendation: Go long the Japanese yen. As bond yield differentials re-tighten, the yen will rally. Additionally, the yen will benefit from its haven status in a period of recessionary risk. Fractal trading watchlist: JPY/USD, GBP/USD, and Australian basic resources. If 2022-23 = 1981-82, Then This Is What Happens To The Stock Market
If 2022-23 = 1981-82, Then This Is What Happens To The Stock Market
If 2022-23 = 1981-82, Then This Is What Happens To The Stock Market
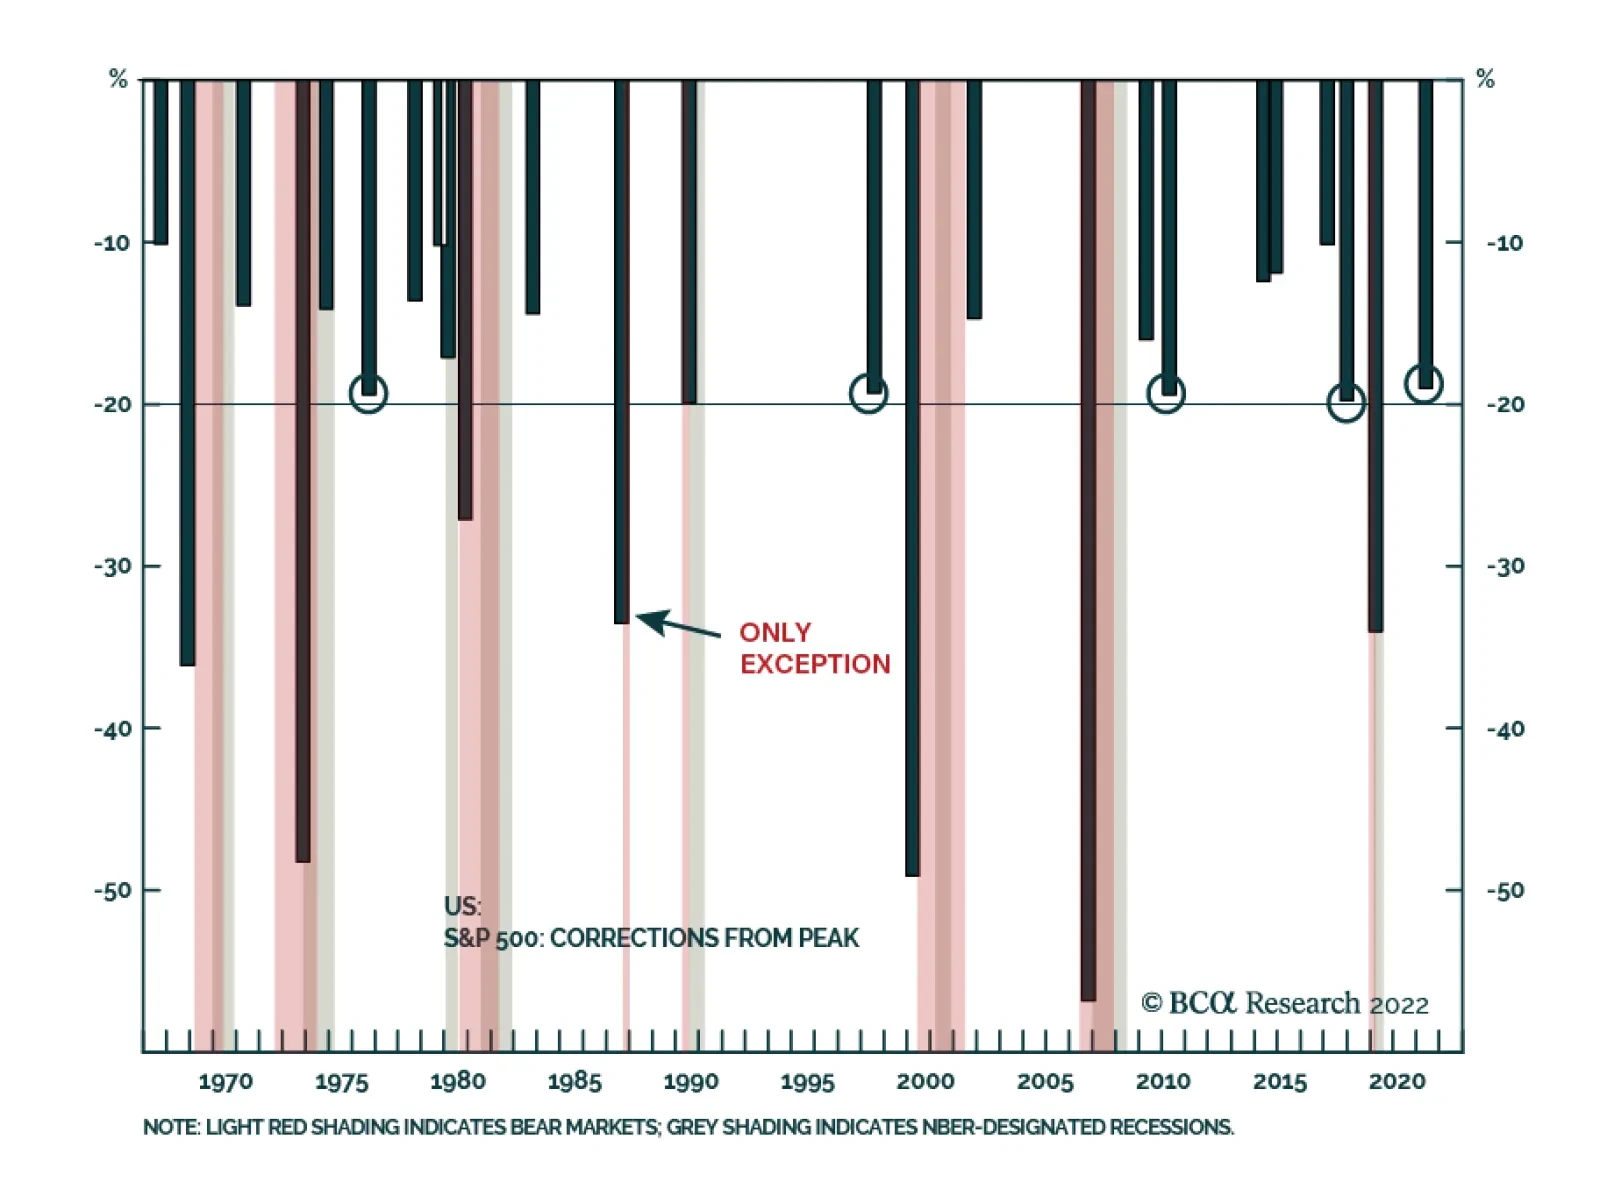
Bottom Line: The risk is that the valuation-driven sell-off morphs into a profits-driven sell-off. Feature In May, many stock markets reached the drawdown of 20 percent that defines a technical bear market. Yet what has caught many people off guard is that the bear market in stocks has happened during a bull market in profits. Since the start of 2022, US profits are up by 5 percent.1 The bear market in stocks has happened during a bull market in profits… so far. This shatters the shibboleth that bear markets only happen when there is a profits recession. The 2022 bear market has been a valuation-driven bear market. US profits rose 5 percent, but the multiple paid for those profits collapsed by 25 percent, taking the market into bear territory. None of this should come as any surprise to our regular readers. As we have pointed out many times, a stock market can be likened to a bond with a variable rather than a fixed income. So, just as with a bond, every stock market has a ‘duration’ which establishes which bond it most behaves like. It turns out that that long-duration US stock market has the same duration as a 30-year bond. This means that: The US stock market = (The 30-year T-bond price) multiplied by (US profits) It follows that if the 30-year bond price falls by more than profits rise, then the stock market will sell off. And if the 30-year bond price falls by much more than profits rise, then the stock market will enter a valuation-driven bear market. Therein lies the story of 2022 so far (Chart I-1). Chart I-1The Bear Market Is Valuation-Driven. Profits Are Up... For Now
The Bear Market Is Valuation-Driven. Profits Are Up... For Now
The Bear Market Is Valuation-Driven. Profits Are Up... For Now
Just As In 1981-82, Will The Sell-Off Morph From Valuation-Driven To Profits-Driven? In Markets Echo 1981, When Stagflation Morphed Into Recession, we argued that a good template for what happens to the economy and the markets in 2022-23 is the experience of 1981-82. Does 2022-23 = 1981-82? Then, just as now, the world’s central banks were obsessed with ‘breaking the back’ of inflation, and piloting the economy to a ‘soft landing’. Then, just as now, the central banks were desperate to repair their badly damaged credibility in managing the economy. And then, just as now, an invasion-led war between two major commodity producers – Iran and Iraq – was disrupting commodity supplies and adding to inflationary pressures. In 1981, just as now, the equity market sell-off started as a valuation sell-off, driven by a declining 30-year T-bond price. Profits held up through most of 1981, just as they have so far in 2022. In September 1981, US core inflation finally peaked, with bond yields following soon after. In the current experience, March 2022 appears to have marked the equivalent peak in US core inflation (Chart I-2 and Chart I-3). Chart I-2Does September 1981...
Does September 1981...
Does September 1981...
Chart I-3...Equal March 2022?
...Equal March 2022?
...Equal March 2022?
In late 1981, when the 30-year T-bond price rebounded, the good news was that beaten-down equity valuations also reached their low point. The bad news was that just as the valuation-driven sell-off ended, profits keeled over, and the valuation-driven sell-off morphed into a profits-driven sell-off (Chart I-4). In 2022-23, could history repeat? Chart I-4In September 1981, The Sell-Off Morphed From Valuation-Driven To Profits-Driven
In September 1981, The Sell-Off Morphed From Valuation-Driven To Profits-Driven
In September 1981, The Sell-Off Morphed From Valuation-Driven To Profits-Driven
Recession Or No Recession? That Is Not The Question History rhymes, it rarely repeats exactly. What if the 2022-23 experience can avoid the outright economic recession of the 1981-82 experience? This brings us to another shibboleth that needs to be shattered. You don’t need the economy to go into recession for profits to go into recession. To understand why, we need to visit the concept of operational leverage. Profits is a small number that comes from the difference of two large numbers: sales and the costs of generating those sales. As any company will tell you, sales can be volatile, but costs – which are dominated by wages – are sticky and much slower to change. The upshot is that if sales growth exceeds costs growth, there is a massively leveraged impact on profits growth. This is the magic of operational leverage. But if sales growth falls below sticky cost growth, the magic turns into a curse. The operational leverage goes into reverse, and profits collapse. Using US stock market profits as an example, the magic turns into a curse at real GDP growth of 1.25 percent, above which profits grow at six times the difference, and below which profits shrink at six times the difference (Chart I-5). Chart I-5A Model For US Profits Growth: (Real GDP Growth - 1.25) Times 6
A Model For US Profits Growth: (Real GDP Growth - 1.25) Times 6
A Model For US Profits Growth: (Real GDP Growth - 1.25) Times 6
Strictly speaking, we should compare US profits growth with world GDP growth because multinationals generate their sales globally rather than domestically. But to the extent that the US has both the world’s largest stock market and the world’s largest economy, it is a reasonable comparison. We should also compare both profits and sales in either nominal or real terms, rather than a mixture. But even with these tweaks, we would still find that the dominant driver of profit growth is operational leverage. ‘Recession or no recession?’ is a somewhat moot question, because even non-recessionary low growth is enough to tip profits into contraction. Therefore, the conclusion still stands – ‘recession or no recession?’ is a somewhat moot question, because even non-recessionary low growth is enough to tip profits into contraction. Such a period of low growth is now likely. If 2022-23 = 1981-82, What Happens Next? To repeat: The US stock market = (The 30-year T-bond price) multiplied by (US profits) This means that investors face a dilemma. The faster that inflation comes down, the better it will be for valuations via a stronger rally in the bond price. But if a collapse in inflation requires a sharp deceleration in growth, the worse it will be for profits. This was the precise set-up in December 1981, the equivalent of June 2022 in our historical template. In which case, what can we expect next? 1. Bond yields are likely in a peaking process, but the sharpest declines may come a few months down the road, after an unambiguous roll-over in food and energy inflation (Chart I-6). Chart I-6If 2022-23 = 1981-82, Then This Is What Happens To The Bond Yield
If 2022-23 = 1981-82, Then This Is What Happens To The Bond Yield
If 2022-23 = 1981-82, Then This Is What Happens To The Bond Yield
2. The stock market’s valuation-driven sell-off is likely over, but the danger is that it morphs into a profits-driven sell-off. As such, the stock market will remain under pressure through 2022, though it is likely to be higher 12 months from now in June 2023 (Chart I-7). Chart I-7If 2022-23 = 1981-82, Then This Is What Happens To The Stock Market
If 2022-23 = 1981-82, Then This Is What Happens To The Stock Market
If 2022-23 = 1981-82, Then This Is What Happens To The Stock Market
3. Long-duration defensive sectors will outperform short-duration cyclical sectors. In other words, tilt towards sectors that benefit the most from rising bond prices and suffer the least from contracting profits. As such, a high conviction recommendation is to overweight healthcare versus basic resources (Chart I-8). Chart I-8If 2022-23 = 1981-82, Then This Is What Happens To Healthcare Versus Resources
If 2022-23 = 1981-82, Then This Is What Happens To Healthcare Versus Resources
If 2022-23 = 1981-82, Then This Is What Happens To Healthcare Versus Resources
4. In foreign exchange, the setup is very bullish for the Japanese yen through the next 12 months. The yen’s recent sell-off is explained by bond yields rising outside Japan. As these bond yield differentials re-tighten, the yen will rally. Additionally, the yen will benefit from its haven status in a period of recessionary risk. A new high conviction recommendation is to go long the Japanese yen (Chart I-9). Chart I-9The Yen's Sell-Off Is Due To Bond Yields Rising Outside Japan
The Yen's Sell-Off Is Due To Bond Yields Rising Outside Japan
The Yen's Sell-Off Is Due To Bond Yields Rising Outside Japan
Fractal Trading Watchlist Supporting our bullish fundamental case for the Japanese yen, the sell-off in JPY/USD has reached the point of fragility on its 260-day fractal structure that marked previous major turning points in 2013 and 2015 (Chart 10). Hence, a first new trade is long JPY/USD, setting the trade length at 6 months, and the profit target and symmetrical stop-loss at 5 percent. Chart I-10The Sell-Off In JPY/USD Has Reached A Potential Turning Point
The Sell-Off In JPY/USD Has Reached A Potential Turning Point
The Sell-Off In JPY/USD Has Reached A Potential Turning Point
Supporting our bearish fundamental case for resources stocks, the outperformance of Australian basic resources has reached the point of fragility on its 130-day fractal structure that marked previous turning points in 2013, 2015, and 2021 (Chart I-11). Hence, a second new trade is short Australian basic resources versus the world market, setting the trade length at 6 months, and the profit target and symmetrical stop-loss at 10 percent. Chart I-11The Australian Basic Resources Sector Is Vulnerable To Reversal
The Australian Basic Resources Sector Is Vulnerable To Reversal
The Australian Basic Resources Sector Is Vulnerable To Reversal
Finally, we are adding GBP/USD to our watchlist, given that its 260-day fractal structure is close to the point of fragility that marked major turns in 2014, 2015, and 2016. Our full watchlist of 29 investments that are at, or approaching turning points, is available on our website: cpt.bcaresearch.com Fractal Trading Watchlist: New Additions GBP/USD At A Turning Point
GBP/USD At A Turning Point
GBP/USD At A Turning Point
Chart 1AUD/KRW Is Vulnerable To Reversal
AUD/KRW Is Vulnerable To Reversal
AUD/KRW Is Vulnerable To Reversal
Chart 2Canada Versus Japan Is Reversing
Canada Versus Japan Is Reversing
Canada Versus Japan Is Reversing
Chart 3Canada's TSX-60's Outperformance Might Be Over
Canada's TSX-60's Outperformance Might Be Over
Canada's TSX-60's Outperformance Might Be Over
Chart 4US Healthcare Providers Vs. Software At Risk of Reversal
US Healthcare Providers Vs. Software At Risk of Reversal
US Healthcare Providers Vs. Software At Risk of Reversal
Chart 5BRL/NZD At A Resistance Point
BRL/NZD At A Resistance Point
BRL/NZD At A Resistance Point
Chart 6Homebuilders Versus Healthcare Services Has Turned
Homebuilders Versus Healthcare Services Has Turned
Homebuilders Versus Healthcare Services Has Turned
Chart 7CNY/USD Has Reversed
CNY/USD Has Reversed
CNY/USD Has Reversed
Chart 8CAD/SEK Reversal Has Started
CAD/SEK Reversal Has Started
CAD/SEK Reversal Has Started
Chart 9Financials Versus Industrials To Reverse
Financials Versus Industrials To Reverse
Financials Versus Industrials To Reverse
Chart 10The Outperformance Of Resources Versus Biotech Has Started To Reverse
The Outperformance Of Resources Versus Biotech Has Started To Reverse
The Outperformance Of Resources Versus Biotech Has Started To Reverse
Chart 11The Outperformance Of Resources Versus Healthcare Is Vulnerable To Reversal
The Outperformance Of Resources Versus Healthcare Is Vulnerable To Reversal
The Outperformance Of Resources Versus Healthcare Is Vulnerable To Reversal
Chart 12FTSE100 Outperformance Vs. Euro Stoxx 50 Is Reversing
FTSE100 Outperformance Vs. Euro Stoxx 50 Is Reversing
FTSE100 Outperformance Vs. Euro Stoxx 50 Is Reversing
Chart 13Netherlands Underperformance Vs. Switzerland Has Been Exhausted
Netherlands Underperformance Vs. Switzerland Has Been Exhausted
Netherlands Underperformance Vs. Switzerland Has Been Exhausted
Chart 14The Sell-Off In The 30-Year T-Bond Is Approaching Fractal Fragility
The Sell-Off In The 30-Year T-Bond Is Approaching Fractal Fragility
The Sell-Off In The 30-Year T-Bond Is Approaching Fractal Fragility
Chart 15The Sell-Off In The NASDAQ Is Approaching Fractal Fragility
The Sell-Off In The NASDAQ Is Approaching Fractal Fragility
The Sell-Off In The NASDAQ Is Approaching Fractal Fragility
Chart 16Food And Beverage Outperformance Has Been Exhausted
Food And Beverage Outperformance Has Been Exhausted
Food And Beverage Outperformance Has Been Exhausted
Chart 17The Strong Trend In The 18-Month-Out US Interest Rate Future Is Fragile
The Strong Trend In The 18-Month-Out US Interest Rate Future Is Fragile
The Strong Trend In The 18-Month-Out US Interest Rate Future Is Fragile
Chart 18The Strong Trend In The 3 Year T-Bond Is Fragile
The Strong Trend In The 3 Year T-Bond Is Fragile
The Strong Trend In The 3 Year T-Bond Is Fragile
Chart 19A Potential Switching Point From Tobacco Into Cannabis
A Potential Switching Point From Tobacco Into Cannabis
A Potential Switching Point From Tobacco Into Cannabis
Chart 20Biotech Is A Major Buy
Biotech Is A Major Buy
Biotech Is A Major Buy
Chart 21Norway's Outperformance Could End
Norway's Outperformance Could End
Norway's Outperformance Could End
Chart 22Cotton Versus Platinum Is Reversing
Cotton Versus Platinum Is Reversing
Cotton Versus Platinum Is Reversing
Chart 23Switzerland's Outperformance Vs. Germany Has Started To End
Switzerland's Outperformance Vs. Germany Has Started To End
Switzerland's Outperformance Vs. Germany Has Started To End
Chart 24The Rally In USD/EUR Has Ended
The Rally In USD/EUR Has Ended
The Rally In USD/EUR Has Ended
Chart 25The Outperformance Of MSCI Hong Kong Versus China Is Vulnerable To Reversal
The Outperformance Of MSCI Hong Kong Versus China Is Vulnerable To Reversal
The Outperformance Of MSCI Hong Kong Versus China Is Vulnerable To Reversal
Chart 26A Potential New Entry Point Into Petcare
A Potential New Entry Point Into Petcare
A Potential New Entry Point Into Petcare
Chart 27Czech Outperformance Near Exhaustion
Czech Outperformance Near Exhaustion
Czech Outperformance Near Exhaustion
Chart 28US REITS Are Oversold Versus Utilities
US REITS Are Oversold Versus Utilities
US REITS Are Oversold Versus Utilities
Chart 29GBP/USD At A Turning Point
GBP/USD At A Turning Point
GBP/USD At A Turning Point
Dhaval Joshi Chief Strategist dhaval@bcaresearch.com Footnotes 1 Defined as 12-month forward earnings per share. Fractal Trading System
More On 2022-23 = 1981-82, And The Danger Ahead
More On 2022-23 = 1981-82, And The Danger Ahead
More On 2022-23 = 1981-82, And The Danger Ahead
More On 2022-23 = 1981-82, And The Danger Ahead
6-Month Recommendations Structural Recommendations Closed Fractal Trades Indicators To Watch - Bond Yields Chart II-1Indicators To Watch - Bond Yields - Euro Area
Indicators To Watch - Bond Yields - Euro Area
Indicators To Watch - Bond Yields - Euro Area
Chart II-2Indicators To Watch - Bond Yields - Europe Ex Euro Area
Indicators To Watch - Bond Yields - Europe Ex Euro Area
Indicators To Watch - Bond Yields - Europe Ex Euro Area
Chart II-3Indicators To Watch - Bond Yields - Asia
Indicators To Watch - Bond Yields - Asia
Indicators To Watch - Bond Yields - Asia
Chart II-4Indicators To Watch - Bond Yields - Other Developed
Indicators To Watch - Bond Yields - Other Developed
Indicators To Watch - Bond Yields - Other Developed
Indicators To Watch - Interest Rate Expectations Chart II-5Indicators To Watch - Interest Rate Expectations
Indicators To Watch - Interest Rate Expectations
Indicators To Watch - Interest Rate Expectations
Chart II-6Indicators To Watch - Interest Rate Expectations
Indicators To Watch - Interest Rate Expectations
Indicators To Watch - Interest Rate Expectations
Chart II-7Indicators To Watch - Interest Rate Expectations
Indicators To Watch - Interest Rate Expectations
Indicators To Watch - Interest Rate Expectations
Chart II-8Indicators To Watch - Interest Rate Expectations
Indicators To Watch - Interest Rate Expectations
Indicators To Watch - Interest Rate Expectations
According to BCA Research’s Global Asset Allocation service, the jury is out on the probability of a recession – and is likely to stay out for a while. Global equities will probably move sideways, with significant volatility. Equity markets – with US…
According to BCA Research’s Global Fixed Income Strategy & US Bond Strategy services energy bonds offer the most compelling combination of valuation and fundamental support within US investment grade. Despite the strong outperformance of high-yield…
Executive Summary European Spreads Have Cheapened Up More Than US Spreads
European Spreads Have Cheapened Up More Than US Spreads
European Spreads Have Cheapened Up More Than US Spreads
Corporate bond spreads in the US and Europe have widened since early April, with European credit taking a bigger hit because of worsening growth and inflation momentum. European corporate bond valuations look fairly cheap, both for investment grade and high-yield. This is true in absolute terms but also relative to the US, where spread valuations are more mixed. An easing of stagflation fears in Europe is a necessary condition for a valuation convergence with the US. The US investment grade credit curve is steep relative to the overall level of credit spreads, making longer-maturity corporates more attractive. Energy bonds offer the most compelling combination of valuation and fundamental support (from high oil prices) within US investment grade. Within US high-yield, Energy valuations look much less compelling after the recent outperformance. The best medium-term industry values in European credit are in investment grade Financials and high-yield Consumer Cyclicals & Non-Cyclicals. Bottom Line: Continue to favor both US high-yield and European investment grade corporates versus US investment grade. Stay neutral high-yield exposure on both sides of the Atlantic. Within Europe, stay up in quality within both investment grade and high-yield until near-term macro risks on growth & inflation subside. Feature Corporate bonds in the US and Europe have gone through a rough patch in recent weeks, underperforming government bonds in response to the “triple threat” of high inflation, tightening monetary policy and slowing growth momentum. European credit has taken the more severe hit compared to the US, with markets pricing in greater risk premia because of additional regional threats to growth (and inflation) from the Ukraine war. In this Special Report, jointly presented by BCA Research US Bond Strategy and Global Fixed Income Strategy, we assess credit spread valuations in US and European corporates after the latest selloff, across credit tiers, maturities and industry groups. Stay Cautious On US Corporate Bonds Chart 1US Credit Spreads
US Credit Spreads
US Credit Spreads
In a recent Special Report, we argued in favor of a relatively defensive allocation to US corporate bonds. Specifically, we advised investors to adopt an underweight (2 out of 5) allocation to US investment grade corporates and a neutral (3 out of 5) allocation to US high-yield. Our rationale was that a flat US Treasury curve signaled that we were in the middle-to-late stages of the economic recovery. Additionally, at the time, corporate bond spreads weren’t all that attractive compared to the average levels seen during the last Fed tightening cycle (Chart 1). Spreads have widened somewhat since we downgraded our allocation and, as such, we see some scope for spread tightening during the next few months as inflation rolls over and the Fed lifts rates by no more than what is already priced in the curve. That said, with the Fed in the midst of a tightening cycle, we think it’s unlikely that spreads can stay below average 2017-19 levels for any meaningful length of time. As a result, we maintain our current cautious allocation to US corporate bonds. US High-Yield Versus US Investment Grade The recent period of US corporate bond underperformance can be split into two stages based on the relative performance of investment grade and high-yield. US investment grade underperformed junk in the early stages of the selloff (between September and mid-March), as spread widening was driven by the Fed’s shift toward a more restrictive policy stance and not a meaningful uptick in the perceived risk of a recession and/or default wave (Chart 2A). Chart 2ACorporate Bond Excess Returns* Versus Duration-Times-Spread: September 27, 2021 To March 14, 2022
Looking For Opportunities In US & European Corporates After The Recent Selloff
Looking For Opportunities In US & European Corporates After The Recent Selloff
But recession and default fears started to ramp up in mid-March, and this caused high-yield to join the selloff (Chart 2B). In fact, US investment grade corporates managed to recoup some of their earlier losses while lower-rated junk bonds struggled to keep pace. Chart 2BCorporate Bond Excess Returns* Versus Duration-Times-Spread: March 14, 2022 To Present
Looking For Opportunities In US & European Corporates After The Recent Selloff
Looking For Opportunities In US & European Corporates After The Recent Selloff
We contend that the risk of a meaningful uptick in corporate defaults during the next 12 months is low. In fact, we estimate that the US high-yield default rate will fall to between 2.7% and 3.7% during the next year, well below the 5.2% currently priced into junk spreads. Going forward, we expect the US corporate bond landscape to be defined by increasingly restrictive monetary policy and a benign default outlook. As we noted in the aforementioned Special Report, this environment is reminiscent of the 2004-06 Fed tightening cycle when high-yield bonds performed much better than investment grade. Investors should maintain a preference for high-yield over investment grade within an otherwise defensive allocation to US corporate bonds. US Industry Groups Chart 3A shows the performance of US corporate bonds in the early stages of the recent selloff, but this time split by industry group. High-yield Energy sticks out as a strong outperformer, though we also notice that every high-yield sector performed better than its investment grade counterpart. Chart 3ACorporate Bond Excess Returns* Versus Duration-Times-Spread: September 27, 2021 To March 14, 2022
Looking For Opportunities In US & European Corporates After The Recent Selloff
Looking For Opportunities In US & European Corporates After The Recent Selloff
Chart 3B once again shows how the relative performance between investment grade and high-yield has flipped since mid-March, though we see that high-yield Energy, Transportation and Utilities have performed better than the rest of the index. Chart 3BCorporate Bond Excess Returns* Versus Duration-Times-Spread: March 14, 2022 To Present
Looking For Opportunities In US & European Corporates After The Recent Selloff
Looking For Opportunities In US & European Corporates After The Recent Selloff
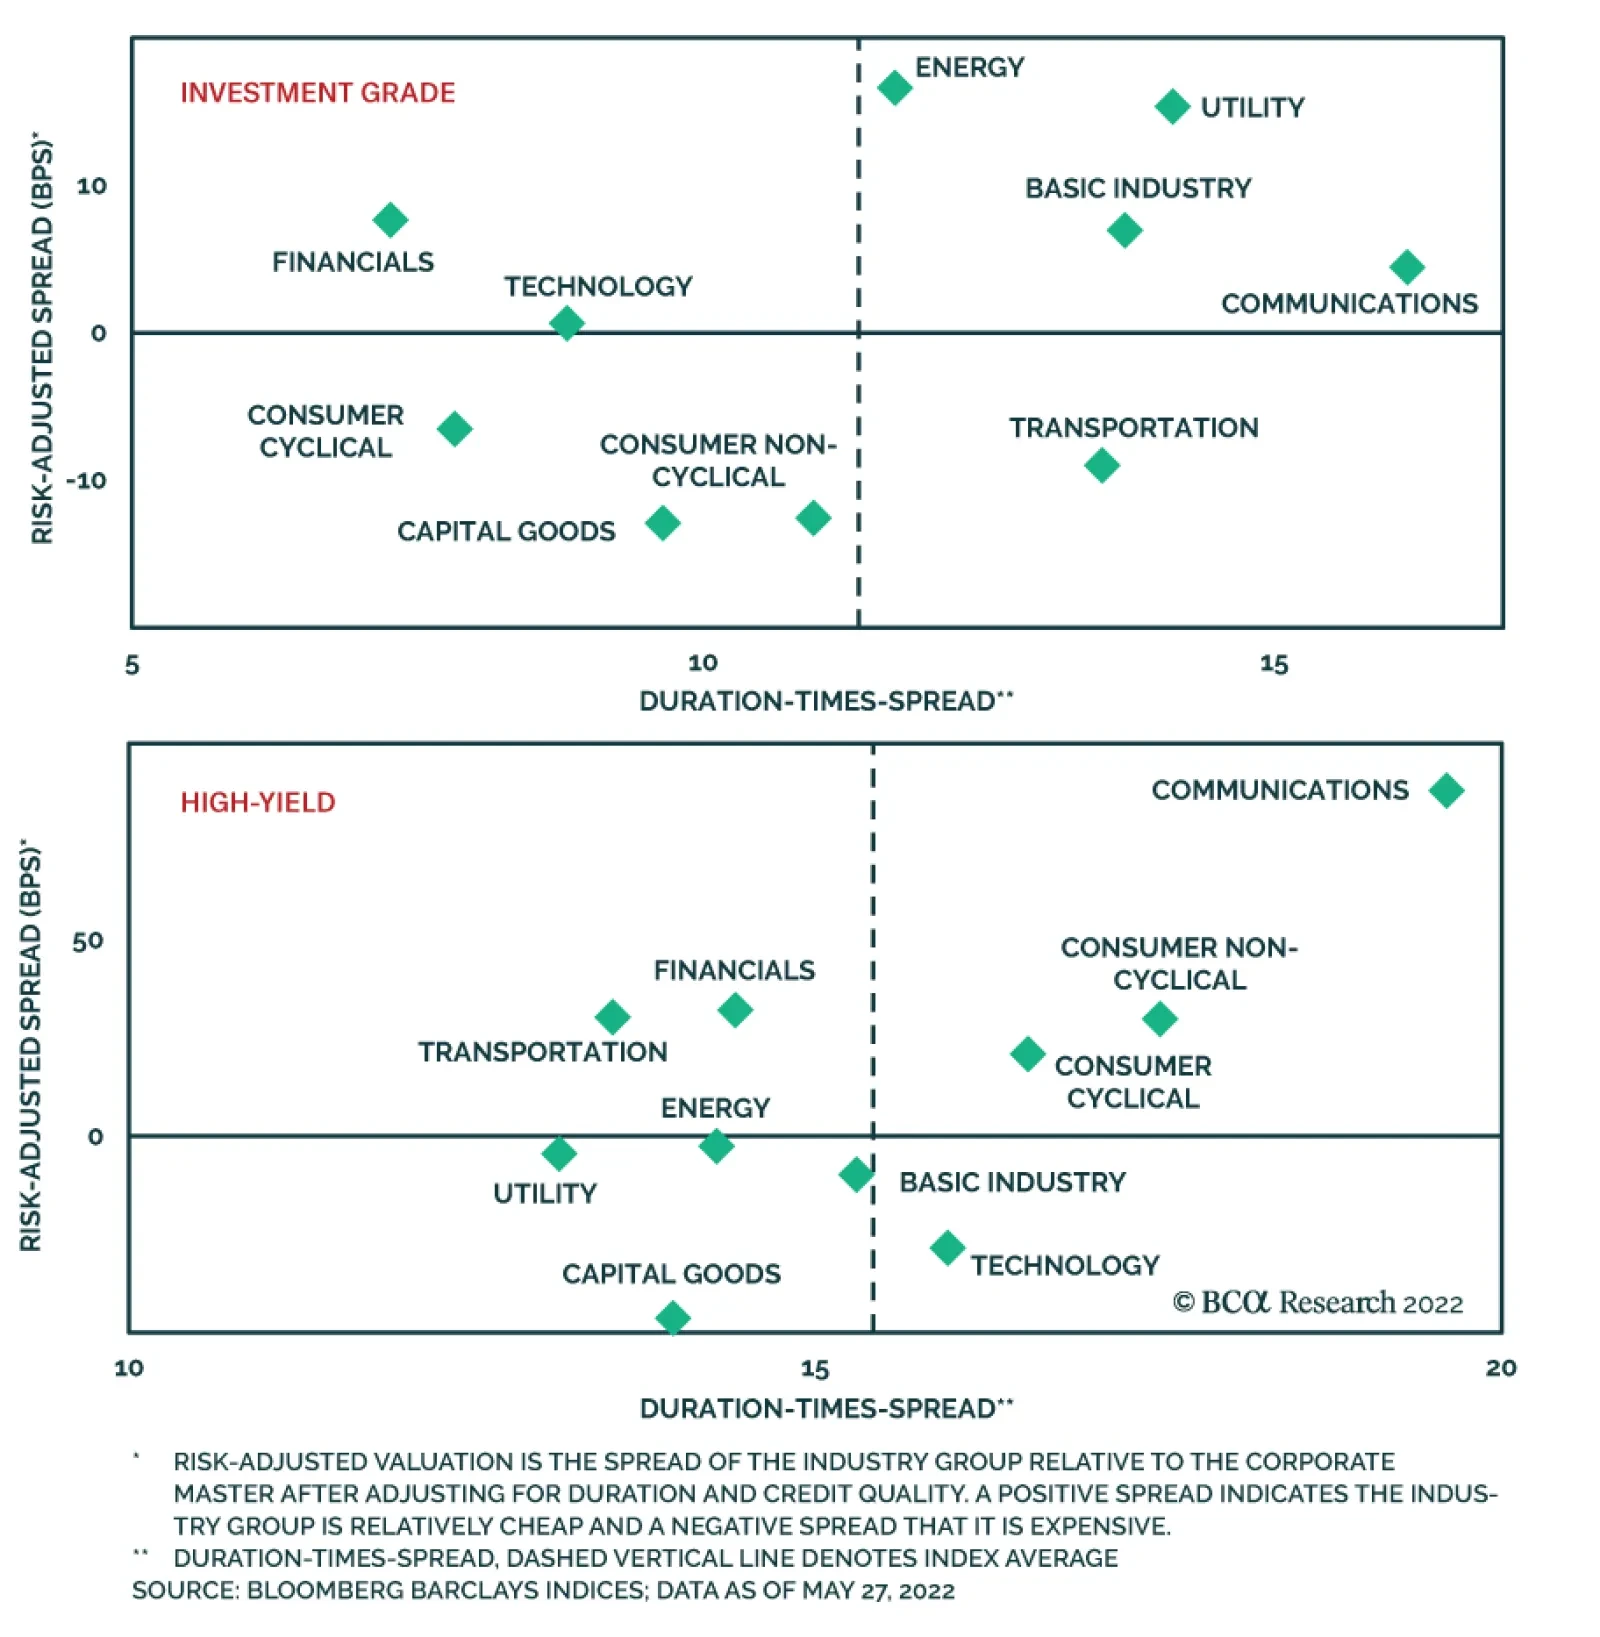
Interestingly, despite the strong outperformance of high-yield Energy bonds, investment grade Energy credits performed mostly in line with other investment grade sectors. We believe this presents an excellent opportunity. The vertical axis of Chart 4A shows our measure of the risk-adjusted spread available in each investment grade industry group. Our risk-adjusted spread is the residual after adjusting for each sector’s credit rating and duration. The horizontal axis shows each sector’s Duration-Times-Spread as a simple measure of risk. Our model shows that Financials, Technology, Energy, Utilities, Communications and Basic Industry all stand out as attractive within the investment grade corporate bond universe. We identify the investment grade Energy sector as a particularly compelling buy. Chart 4AUS Investment Grade Corporate Sector Valuation
Looking For Opportunities In US & European Corporates After The Recent Selloff
Looking For Opportunities In US & European Corporates After The Recent Selloff
In a prior report, we demonstrated, unsurprisingly, that the oil price is an important determinant of whether Energy bonds perform better or worse than the rest of the corporate index. With our commodity strategists calling for the Brent crude oil price to average $122/bbl next year, this will provide strong support to Energy bond returns. Cheap starting valuations for investment grade Energy bonds make them look even more compelling. Chart 4B repeats our valuation exercise but for high-yield industry groups. Within high-yield, we find that Financials, Transportation, Communications and Consumer sectors stand out as attractive. Interestingly, high-yield Energy bonds now look slightly expensive compared to the rest of the junk bond universe, a result of the sector’s recent incredibly strong performance. Chart 4BUS High-Yield Corporate Sector Valuation
Looking For Opportunities In US & European Corporates After The Recent Selloff
Looking For Opportunities In US & European Corporates After The Recent Selloff
US Credit Curve We define the credit curve as the difference in option-adjusted spread between the “Long Maturity” and “Intermediate Maturity” sub-indexes for each investment grade credit tier, as defined by Bloomberg. We exclude high-yield from this analysis because very few high-yield bonds are classified as “Long Maturity”. To analyze the credit curve, we observe that credit curves tend to be steeper when credit spreads are tight, and vice-versa. This is because tight spreads indicate that the perceived near-term risk of default is low. As a result, short-maturity spreads tend to be lower than spreads at the long-end of the curve. Conversely, a wide spread environment indicates that the perceived near-term risk of default is high, and this risk will be more reflected in shorter maturity credits. Charts 5A, 5B and 5C show the slopes of the credit curves for Aa, A and Baa-rated securities. Immediately we notice that credit curves are positively sloped in each case, and also that each credit curve is somewhat steeper than would be predicted based on the average spread for the overall credit tier. Chart 5AAa-Rated Credit Curve
Looking For Opportunities In US & European Corporates After The Recent Selloff
Looking For Opportunities In US & European Corporates After The Recent Selloff
Chart 5BA-Rated Credit Curve
Looking For Opportunities In US & European Corporates After The Recent Selloff
Looking For Opportunities In US & European Corporates After The Recent Selloff
Chart 5CBaa-Rated Credit Curve
Looking For Opportunities In US & European Corporates After The Recent Selloff
Looking For Opportunities In US & European Corporates After The Recent Selloff
This strongly suggests that investors should favor long-maturity over short-maturity US investment grade corporate bonds. European Corporates Look Cheap Vs. US Equivalents – For Patient Investors Chart 6European Credit Spreads At Past 'Non-Crisis' Peaks
European Credit Spreads At Past 'Non-Crisis' Peaks
European Credit Spreads At Past 'Non-Crisis' Peaks
Turning to the euro area, the Bloomberg investment grade OAS and high-yield OAS currently sit at 167bps and 490bps, respectively (Chart 6). These levels are well below the peaks seen during the 2020 COVID recession and the 2011/12 European debt crisis, but are in line with the spread widening episodes in 2014/15 and 2018. Our preferred measure of credit spread valuation, 12-month breakeven spreads, show that European investment grade and high-yield spreads are in the 75th and 67th percentile of outcomes, respectively, dating back to the inception of the euro in 1998 (Chart 7).1 These are both higher compared to the breakeven percentile rankings for US investment grade (48%) and US high-yield (52%). The gap between the breakeven percentile rankings for investment grade bonds in the euro area versus the US is the widest seen over the past two decades. That gap reflects the fact that European economic growth has softened versus the US according to the S&P Global manufacturing PMIs, while European inflation has accelerated towards very elevated US levels (Chart 8). Chart 7European Spreads Have Cheapened Up More Than US Spreads
European Spreads Have Cheapened Up More Than US Spreads
European Spreads Have Cheapened Up More Than US Spreads
Chart 8European Corporate Underperformance Reflects Relative Growth & Inflation
European Corporate Underperformance Reflects Relative Growth & Inflation
European Corporate Underperformance Reflects Relative Growth & Inflation
Both of those trends are a product of the Ukraine war, which has led to a massive spike in European energy costs given the region's huge reliance on Russian energy supplies, particularly for natural gas. While the US has also suffered a massive increase in its own energy bills, the inflation spike has been higher in Europe, leading to a bigger drag on economic confidence and growth. Thus, the widening spread differential between corporate bonds in Europe relative to the US likely reflects a growth-related risk premium. Chart 9A Turning Point For European Corporate Bond Performance?
A Turning Point For European Corporate Bond Performance?
A Turning Point For European Corporate Bond Performance?
As euro area inflation has ratcheted higher, so have expectations of ECB monetary tightening. The euro area overnight index swap (OIS) curve now discounts 172bps over the next 12 months, a huge swing from the start of 2022 when markets were expecting the European Central Bank (ECB) to stand pat on the interest rate front. In comparison, markets are pricing in another 224bps of Fed tightening over the next 12 months, even after the Fed has already delivered 75bps of tightening since March. Importantly, the gap between our 12-month discounters, which measure one-year-ahead interest rate changes discounted into OIS curves, for the US and Europe has proven to be a reliable leading indicator – by around nine months - of the relative year-over-year excess returns (on a USD-hedged basis) of European and US corporate bonds, especially for investment grade (Chart 9). The fact that this is a leading relationship suggests that the upward repricing of ECB rate expectations seen so far in 2022 is not yet a reason to turn more cyclically negative on European corporate bonds versus the US. The earlier upward repricing of expected Fed tightening is the more relevant factor, and is signaling that both US investment grade and high-yield corporates should underperform European equivalents over at least the rest of 2022. BCA Research Global Fixed Income Strategy already has a recommended allocation along those lines, with an overweight to euro area investment grade and an underweight to US investment grade. While the trade has underperformed of late, the combined messages from the relative 12-month breakeven spread rankings (cheaper European valuations) and 12-month discounters (the Fed is further ahead in the tightening cycle) leads us to stick with that relative cross-Atlantic tilt. The main risk to that stance is any deterioration of the flow of energy supplies from Russia to Europe that results in a stagflationary outcome of a bigger growth slowdown with even faster inflation. That is a scenario that would make it difficult for the ECB to back down from its recent hawkish forward guidance, resulting in European corporate spreads incorporating an even wider risk premium. Given that near-term uncertainty, we are advocating that investors maintain no relative tilt on more growth-sensitive, and riskier, European high-yield relative to the US – stay neutral on both. Stay Up In Quality On European Corporates Looking at euro area corporate debt across credit ratings and maturity buckets, there are few compelling immediate valuation stories in absolute terms, although there are potential opportunities unfolding on a relative basis. Within investment grade, credit quality curves have steepened during the recent selloff, with lower-rated credit seeing larger spread widening (Chart 10). The gap between Baa-rated and A-rated European corporate spreads now sits at 52bps, right in the middle of the 25-75bps range since 2014. In high-yield, the gap between Ba-rated and B-rated credit spreads is 222bps, and the gap between B-rated and Caa-rated spreads is 370bps (Chart 11) – both are still below the previous peaks in those relationships seen in 2012, 2015 and 2020. Chart 10European IG Credit Quality Curve Can Steepen ##br##More
European IG Credit Quality Curve Can Steepen More
European IG Credit Quality Curve Can Steepen More
Chart 11European HY Credit Quality Curve Still Below Previous Peaks
European HY Credit Quality Curve Still Below Previous Peaks
European HY Credit Quality Curve Still Below Previous Peaks
For both investment grade and high-yield, there is still room for credit curves to steepen if European growth expectations continue to deteriorate. However, when looking at spread valuations across the credit quality spectrum, and across maturity buckets, euro area corporate spreads look much cheaper than US equivalents. In Chart 12, we show a snapshot of the current 12-month breakeven percentile rankings for individual credit quality tiers and maturity groups, for investment grade and high-yield in the euro area and US. The relative attractiveness of European credit relative to the US is evident, with European spreads now at higher percentile rankings across all quality tiers and maturity buckets. The largest gaps between 12-month breakeven percentile rankings are in the +10 year maturity bucket, the AAA-rated and AA-rated investment grade credit tiers, and the Ba-rated high-yield credit tier. This suggests any trades favoring European corporates versus the US should stay up in credit quality. Chart 12Corporate Spread Valuations By Maturity & Credit Rating Favor Europe
Looking For Opportunities In US & European Corporates After The Recent Selloff
Looking For Opportunities In US & European Corporates After The Recent Selloff
Comparing European & US Industry Spread Valuations When looking at the industry composition of the euro area and US corporate bond indices, there are a few major notable differences. Within investment grade, there is a greater concentration of Energy and Technology names in the US, while Financials are more represented in the European index (Chart 13). Those same three industries also have the largest relative weightings in the high-yield indices (Chart 14), although there is also a slightly larger weighting of high-yield Transportation companies in Europe compared to the US. This means that a bet on European credit versus the US is essentially a bet on European Financials versus US Energy and Technology. Chart 13Investment Grade Corporate Bond Market Cap Weights
Looking For Opportunities In US & European Corporates After The Recent Selloff
Looking For Opportunities In US & European Corporates After The Recent Selloff
Chart 14High-Yield Corporate Bond Market Cap Weights
Looking For Opportunities In US & European Corporates After The Recent Selloff
Looking For Opportunities In US & European Corporates After The Recent Selloff
When looking at the same sector metrics that were shown earlier in this report for the US – comparing risk-adjusted spreads to Duration-Times-Spread – we find some interesting cross-Atlantic valuation differentials. For investment grade in Europe (Chart 15), only Energy and Financials have positive risk-adjusted spread valuations (after controlling for duration and credit quality), while having the highest level of risk expressed via Duration-Times-Spread. This contrasts to the US where more sectors have positive risk-adjusted spreads - Energy, Financials, Utilities, Basic Industry and Communications. Investors should favor the latter three industries in the US relative to Europe. Chart 15Euro Area Investment Grade Corporate Sector Valuation
Looking For Opportunities In US & European Corporates After The Recent Selloff
Looking For Opportunities In US & European Corporates After The Recent Selloff
Within high-yield in Europe, Energy and Financials also offer positive risk-adjusted valuations, but so do Consumer Cyclicals and Consumer Non-Cyclicals (Chart 16). This lines up similarly to US high-yield valuations. The notable valuation gaps exist in Transportation and Communications, which look cheap in the US and expensive in Europe, creating potential cross-Atlantic relative value trade opportunities between those sectors (and within an overall neutral allocation to junk in both regions). Chart 16Euro Area High-Yield Corporate Sector Valuation
Looking For Opportunities In US & European Corporates After The Recent Selloff
Looking For Opportunities In US & European Corporates After The Recent Selloff
Ryan Swift US Bond Strategist rswift@bcaresearch.com Robert Robis, CFA Chief Fixed Income Strategist rrobis@bcaresearch.com Footnotes 1 12-month breakeven spreads measure the amount of spread widening that would be necessary to make the return on corporate bonds equal to that of duration-matched government bonds over a one-year horizon. The spread is calculated as a ratio of the index OAS and index duration for the relevant credit market. We look at the historical percentile ranking of that ratio to make a more “apples for apples” comparison of spreads that factors in index duration changes over time. Recommended Portfolio Specification Other Recommendations Treasury Index Returns Spread Product Returns
BCA Research’s US Equity Strategy service does not expect US consumers to lend a “spending hand” to support economic growth. Inflation continues to put pressure on US consumers. Negative real wage growth is sapping their confidence and is cutting into…